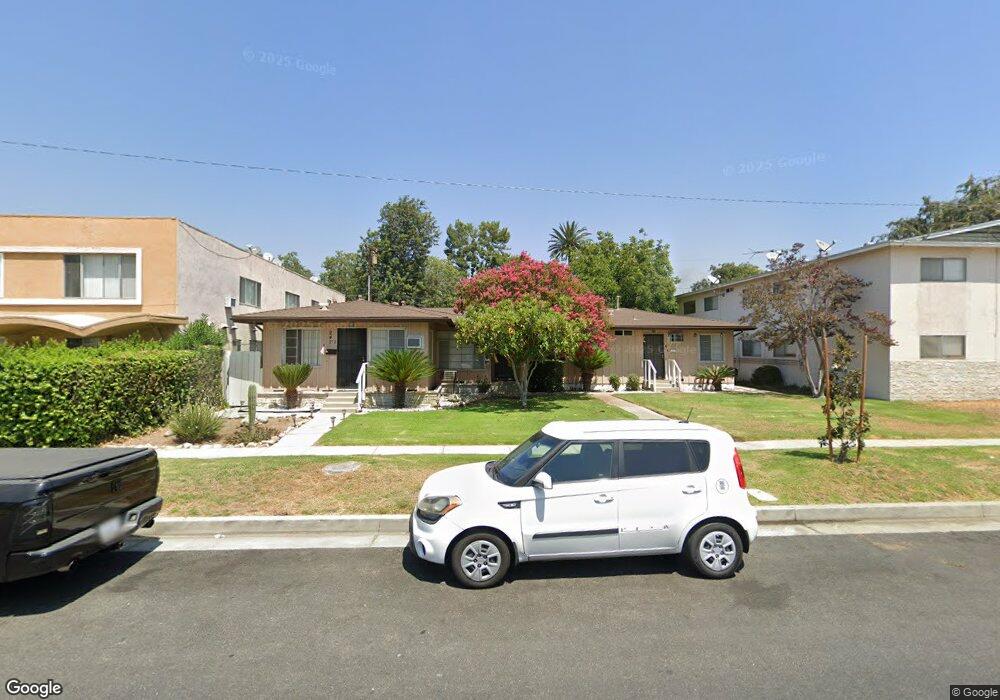
241 Alpine St Upland, CA 91786
Estimated Value: $793,991 - $1,258,000
1
Bed
1
Bath
2,097
Sq Ft
$495/Sq Ft
Est. Value
About This Home
This home is located at 241 Alpine St, Upland, CA 91786 and is currently estimated at $1,036,998, approximately $494 per square foot. 241 Alpine St is a home located in San Bernardino County with nearby schools including Baldy View Elementary School, Upland Junior High School, and Upland High School.
Ownership History
Date
Name
Owned For
Owner Type
Purchase Details
Closed on
Jan 16, 2021
Sold by
Marasigan Frederick U and Marasigan Bridget I
Bought by
Marasigan Frederick U and Marasigan Bridget L
Current Estimated Value
Purchase Details
Closed on
Nov 18, 2015
Sold by
Chiang Chi Hong and Wang Hui Chuan
Bought by
Wang Joseph M
Home Financials for this Owner
Home Financials are based on the most recent Mortgage that was taken out on this home.
Original Mortgage
$361,212
Outstanding Balance
$283,724
Interest Rate
3.75%
Mortgage Type
FHA
Estimated Equity
$753,274
Purchase Details
Closed on
Aug 17, 2010
Sold by
Chiang Chi Hong and Wang Hui Chuan
Bought by
Chiang Chi Hong and Wang Hui Chuan
Purchase Details
Closed on
Aug 15, 2001
Sold by
Gubler John H and Gubler Lisa M
Bought by
Chiang Chi Hong and Wang Hui Chuan
Home Financials for this Owner
Home Financials are based on the most recent Mortgage that was taken out on this home.
Original Mortgage
$169,100
Interest Rate
6.91%
Create a Home Valuation Report for This Property
The Home Valuation Report is an in-depth analysis detailing your home's value as well as a comparison with similar homes in the area
Home Values in the Area
Average Home Value in this Area
Purchase History
| Date | Buyer | Sale Price | Title Company |
|---|---|---|---|
| Marasigan Frederick U | -- | Amrock Llc | |
| Wang Joseph M | $445,000 | Fidelity Sherman Oaks | |
| Chiang Chi Hong | -- | None Available | |
| Chiang Chi Hong | $225,500 | Orange Coast Title |
Source: Public Records
Mortgage History
| Date | Status | Borrower | Loan Amount |
|---|---|---|---|
| Open | Wang Joseph M | $361,212 | |
| Previous Owner | Chiang Chi Hong | $169,100 |
Source: Public Records
Tax History
| Year | Tax Paid | Tax Assessment Tax Assessment Total Assessment is a certain percentage of the fair market value that is determined by local assessors to be the total taxable value of land and additions on the property. | Land | Improvement |
|---|---|---|---|---|
| 2025 | $5,875 | $526,788 | $183,488 | $343,300 |
| 2024 | $5,689 | $516,459 | $179,890 | $336,569 |
| 2023 | $5,603 | $506,333 | $176,363 | $329,970 |
| 2022 | $5,483 | $496,405 | $172,905 | $323,500 |
| 2021 | $5,476 | $486,672 | $169,515 | $317,157 |
| 2020 | $5,328 | $481,682 | $167,777 | $313,905 |
| 2019 | $5,234 | $472,237 | $164,487 | $307,750 |
| 2018 | $5,105 | $462,978 | $161,262 | $301,716 |
| 2017 | $4,957 | $453,900 | $158,100 | $295,800 |
| 2016 | $3,041 | $281,410 | $98,587 | $182,823 |
| 2015 | $2,972 | $277,183 | $97,106 | $180,077 |
| 2014 | $2,895 | $271,754 | $95,204 | $176,550 |
Source: Public Records
Map
Nearby Homes
- 509 N Euclid Ave
- 435 W 9th St Unit B3
- 636 N Palm Ave
- 161 N 1st Ave
- 145 N 1st Ave
- 345 Euclid Place
- 111 N 1st Ave
- 107 N 1st Ave
- 855 N Palm Ave
- 762 N Vallejo Way
- 428 W 8th St
- 910 N Redding Way Unit I
- 910 N Redding Way Unit F
- 885 W Arrow Hwy
- 296 S Laurel Ave
- 511 D St
- 144 Dorsett Ave
- 846 Amber Ct
- 333 White Ave
- 556 D St
- 241 Alpine St Unit 2
- 217 Alpine St
- 273 Alpine St
- 273 Alpine St Unit k
- 273 Alpine St Unit N
- 273 Alpine St Unit F
- 273 Alpine St Unit B
- 273 Alpine St Unit C
- 273 Alpine St Unit E
- 273 Alpine St Unit I
- 273 Alpine St Unit L
- 273 Alpine St Unit M
- 222 W Arrow Hwy
- 244 W Arrow Hwy Unit 1
- 244 W Arrow Hwy
- 270 W Arrow Hwy Unit A
- 270 W Arrow Hwy Unit C
- 270 W Arrow Hwy
- 244 W Alpine St Unit Apartment l
- 220 Alpine St
Your Personal Tour Guide
Ask me questions while you tour the home.