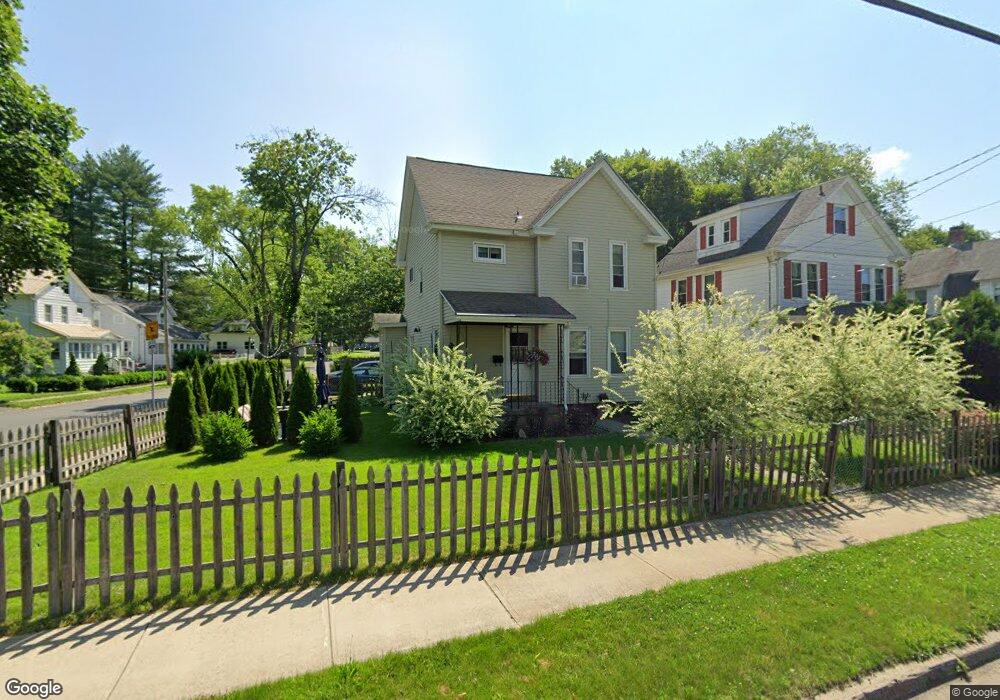
241 Conway St Greenfield, MA 01301
Estimated Value: $266,000 - $322,000
3
Beds
1
Bath
1,224
Sq Ft
$231/Sq Ft
Est. Value
About This Home
This home is located at 241 Conway St, Greenfield, MA 01301 and is currently estimated at $283,274, approximately $231 per square foot. 241 Conway St is a home located in Franklin County with nearby schools including Cornerstone Christian School and Holy Trinity School.
Ownership History
Date
Name
Owned For
Owner Type
Purchase Details
Closed on
Jan 29, 2009
Sold by
Martel Ann M
Bought by
Martel Ann M and Martel Aaron F
Current Estimated Value
Home Financials for this Owner
Home Financials are based on the most recent Mortgage that was taken out on this home.
Original Mortgage
$105,000
Outstanding Balance
$66,434
Interest Rate
5.28%
Estimated Equity
$216,840
Purchase Details
Closed on
Apr 8, 1996
Sold by
Baron Antonia A and Baron Mary C
Bought by
Lacoy Ann M
Create a Home Valuation Report for This Property
The Home Valuation Report is an in-depth analysis detailing your home's value as well as a comparison with similar homes in the area
Home Values in the Area
Average Home Value in this Area
Purchase History
| Date | Buyer | Sale Price | Title Company |
|---|---|---|---|
| Martel Ann M | -- | -- | |
| Martel Ann M | -- | -- | |
| Martel Ann M | -- | -- | |
| Lacoy Ann M | $63,000 | -- | |
| Lacoy Ann M | $63,000 | -- |
Source: Public Records
Mortgage History
| Date | Status | Borrower | Loan Amount |
|---|---|---|---|
| Open | Martel Ann M | $105,000 | |
| Closed | Lacoy Ann M | $105,000 |
Source: Public Records
Tax History Compared to Growth
Tax History
| Year | Tax Paid | Tax Assessment Tax Assessment Total Assessment is a certain percentage of the fair market value that is determined by local assessors to be the total taxable value of land and additions on the property. | Land | Improvement |
|---|---|---|---|---|
| 2025 | $3,589 | $183,500 | $45,700 | $137,800 |
| 2024 | $3,640 | $178,500 | $41,700 | $136,800 |
| 2023 | $3,284 | $167,100 | $41,700 | $125,400 |
| 2022 | $3,205 | $143,600 | $39,700 | $103,900 |
| 2021 | $3,160 | $136,100 | $42,700 | $93,400 |
| 2020 | $3,008 | $131,200 | $38,700 | $92,500 |
| 2019 | $2,764 | $126,200 | $33,700 | $92,500 |
| 2018 | $2,772 | $123,600 | $33,100 | $90,500 |
| 2017 | $2,686 | $123,600 | $33,100 | $90,500 |
| 2016 | $2,556 | $117,200 | $28,800 | $88,400 |
| 2015 | $2,537 | $112,700 | $29,100 | $83,600 |
| 2014 | $2,314 | $112,700 | $29,100 | $83,600 |
Source: Public Records
Map
Nearby Homes