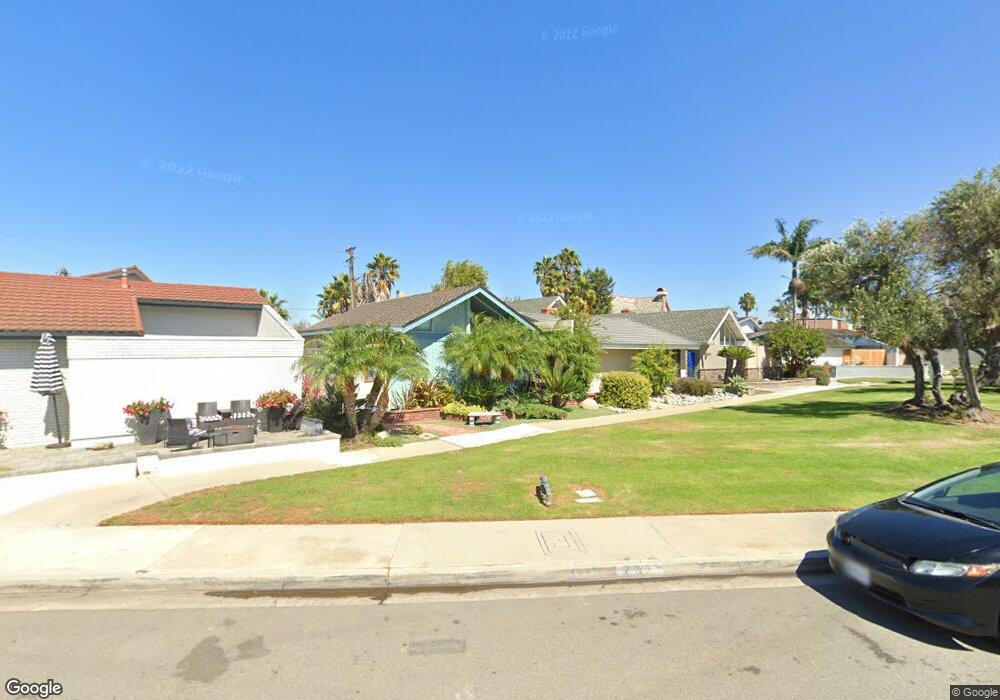
241 Corsair Way Seal Beach, CA 90740
Estimated Value: $1,412,314 - $2,002,000
2
Beds
2
Baths
1,253
Sq Ft
$1,290/Sq Ft
Est. Value
About This Home
This home is located at 241 Corsair Way, Seal Beach, CA 90740 and is currently estimated at $1,616,829, approximately $1,290 per square foot. 241 Corsair Way is a home located in Orange County with nearby schools including J. H. Mcgaugh Elementary School, Jack L. Weaver Elementary School, and Sharon Christa Mcauliffe Middle School.
Ownership History
Date
Name
Owned For
Owner Type
Purchase Details
Closed on
Sep 27, 2024
Sold by
Keables Benda Marlene
Bought by
Marlene Keables Benda Family Trust and Benda
Current Estimated Value
Purchase Details
Closed on
May 31, 2023
Sold by
Benda Randall N
Bought by
Benda Marlene Keables
Purchase Details
Closed on
Jan 13, 2010
Sold by
Walter Charles G
Bought by
Benda Randall N and Benda Marlene K
Home Financials for this Owner
Home Financials are based on the most recent Mortgage that was taken out on this home.
Original Mortgage
$365,000
Interest Rate
4.97%
Mortgage Type
New Conventional
Purchase Details
Closed on
Apr 18, 2000
Sold by
Mitchell Fred A
Bought by
Mitchell Fred A and The Fred A Mitchell Living Trust
Create a Home Valuation Report for This Property
The Home Valuation Report is an in-depth analysis detailing your home's value as well as a comparison with similar homes in the area
Home Values in the Area
Average Home Value in this Area
Purchase History
| Date | Buyer | Sale Price | Title Company |
|---|---|---|---|
| Marlene Keables Benda Family Trust | -- | None Listed On Document | |
| Benda Marlene Keables | -- | None Listed On Document | |
| Benda Randall N | -- | None Listed On Document | |
| Benda Randall N | $490,000 | Chicago Title Company | |
| Mitchell Fred A | -- | -- |
Source: Public Records
Mortgage History
| Date | Status | Borrower | Loan Amount |
|---|---|---|---|
| Previous Owner | Benda Randall N | $365,000 |
Source: Public Records
Tax History Compared to Growth
Tax History
| Year | Tax Paid | Tax Assessment Tax Assessment Total Assessment is a certain percentage of the fair market value that is determined by local assessors to be the total taxable value of land and additions on the property. | Land | Improvement |
|---|---|---|---|---|
| 2025 | $10,460 | $903,572 | $792,542 | $111,030 |
| 2024 | $10,460 | $885,855 | $777,002 | $108,853 |
| 2023 | $10,226 | $868,486 | $761,767 | $106,719 |
| 2022 | $10,119 | $851,457 | $746,830 | $104,627 |
| 2021 | $9,894 | $834,762 | $732,186 | $102,576 |
| 2020 | $9,908 | $826,203 | $724,678 | $101,525 |
| 2019 | $9,604 | $810,003 | $710,468 | $99,535 |
| 2018 | $9,166 | $794,121 | $696,537 | $97,584 |
| 2017 | $8,973 | $778,550 | $682,879 | $95,671 |
| 2016 | $8,803 | $763,285 | $669,489 | $93,796 |
| 2015 | $8,693 | $751,820 | $659,432 | $92,388 |
| 2014 | $8,483 | $737,093 | $646,514 | $90,579 |
Source: Public Records
Map
Nearby Homes
- 18 Cottonwood Ln
- 123 Cottonwood Ln
- 30 Welcome Ln
- 48 Riversea Rd
- 96 Welcome Ln
- 41 Riversea Rd
- 73 Riversea Rd
- 85 Riversea Rd
- 84 Riversea Rd
- 244 5th St
- 207 1st St
- 208 Ocean Place
- 620 Coastline Dr
- 112 114 4th St
- 232 7th St
- 815 Marvista Ave
- 900 Catalina Ave
- 805 Ocean Ave Unit 6
- 217 10th St
- 7019 E Seaside Walk
- 233 Corsair Way
- 249 Corsair Way
- 225 Corsair Way
- 257 Corsair Way
- 217 Corsair Way
- 265 Corsair Way
- 273 Corsair Way
- 281 Corsair Way
- 260 Corsair Way
- 250 Corsair Way
- 270 Corsair Way
- 240 Corsair Way
- 289 Corsair Way
- 280 Corsair Way
- 230 Corsair Way
- 290 Corsair Way
- 220 Corsair Way
- 297 Corsair Way
- 300 Corsair Way
- 210 Corsair Way