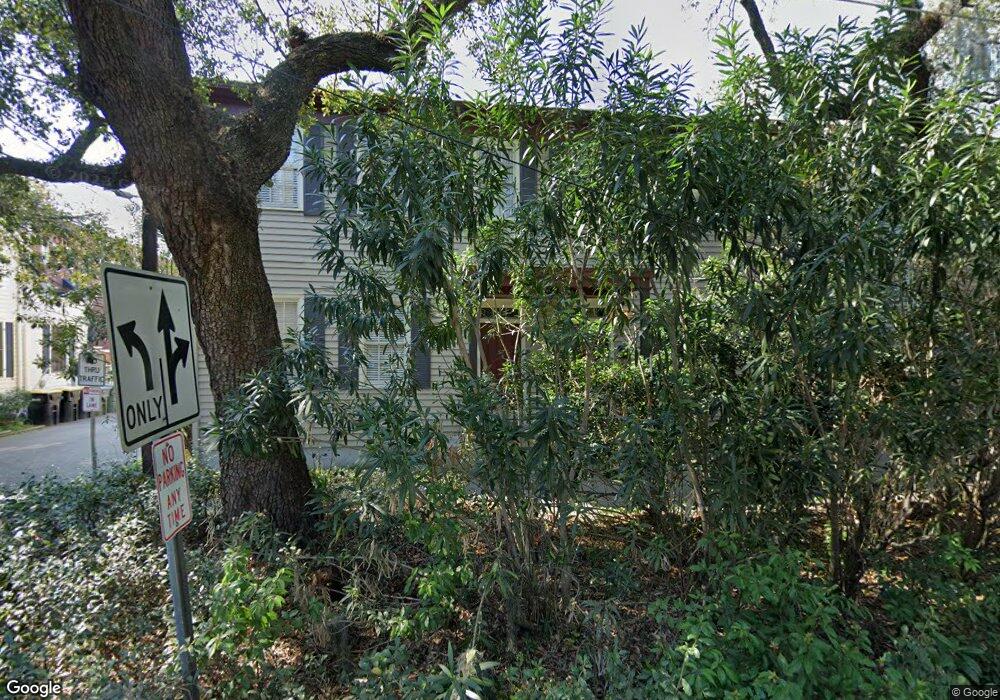
241 E Broad St Savannah, GA 31401
Historic Savannah NeighborhoodEstimated Value: $667,730 - $799,000
6
Beds
4
Baths
2,948
Sq Ft
$255/Sq Ft
Est. Value
About This Home
This home is located at 241 E Broad St, Savannah, GA 31401 and is currently estimated at $752,433, approximately $255 per square foot. 241 E Broad St is a home located in Chatham County with nearby schools including Spencer Elementary School, Hubert Middle School, and Savannah Arts Academy.
Ownership History
Date
Name
Owned For
Owner Type
Purchase Details
Closed on
Mar 31, 2021
Sold by
Beytagh House Llc
Bought by
Gibbons Stephanie L and Gibbons Matthew D
Current Estimated Value
Home Financials for this Owner
Home Financials are based on the most recent Mortgage that was taken out on this home.
Original Mortgage
$425,200
Outstanding Balance
$382,236
Interest Rate
3%
Mortgage Type
New Conventional
Estimated Equity
$370,197
Purchase Details
Closed on
May 17, 2013
Sold by
Petit Paul R
Bought by
Beytagh House Llc
Home Financials for this Owner
Home Financials are based on the most recent Mortgage that was taken out on this home.
Original Mortgage
$220,000
Interest Rate
3.42%
Mortgage Type
Commercial
Purchase Details
Closed on
Jul 8, 2005
Sold by
Not Provided
Bought by
Kare Ganem and Kare Schroder
Home Financials for this Owner
Home Financials are based on the most recent Mortgage that was taken out on this home.
Original Mortgage
$320,476
Interest Rate
5.46%
Mortgage Type
Commercial
Create a Home Valuation Report for This Property
The Home Valuation Report is an in-depth analysis detailing your home's value as well as a comparison with similar homes in the area
Home Values in the Area
Average Home Value in this Area
Purchase History
| Date | Buyer | Sale Price | Title Company |
|---|---|---|---|
| Gibbons Stephanie L | $472,500 | -- | |
| Beytagh House Llc | -- | -- | |
| Kare Ganem | $390,100 | -- | |
| Kare Ganem | $390,100 | -- |
Source: Public Records
Mortgage History
| Date | Status | Borrower | Loan Amount |
|---|---|---|---|
| Open | Gibbons Stephanie L | $425,200 | |
| Previous Owner | Beytagh House Llc | $220,000 | |
| Previous Owner | Kare Ganem | $320,476 | |
| Previous Owner | Kare Ganem | $25,557 |
Source: Public Records
Tax History
| Year | Tax Paid | Tax Assessment Tax Assessment Total Assessment is a certain percentage of the fair market value that is determined by local assessors to be the total taxable value of land and additions on the property. | Land | Improvement |
|---|---|---|---|---|
| 2025 | $7,317 | $265,360 | $100,000 | $165,360 |
| 2024 | $61 | $230,720 | $63,000 | $167,720 |
| 2023 | $2,544 | $208,560 | $48,000 | $160,560 |
| 2022 | $3,030 | $172,120 | $32,400 | $139,720 |
| 2021 | $4,323 | $98,280 | $18,000 | $80,280 |
| 2020 | $2,675 | $93,280 | $18,000 | $75,280 |
| 2019 | $3,764 | $84,720 | $18,000 | $66,720 |
| 2018 | $3,810 | $84,720 | $18,000 | $66,720 |
| 2017 | $3,038 | $84,720 | $18,000 | $66,720 |
| 2016 | $2,139 | $73,320 | $18,000 | $55,320 |
| 2015 | $3,116 | $74,720 | $18,200 | $56,520 |
| 2014 | $4,172 | $77,080 | $0 | $0 |
Source: Public Records
Map
Nearby Homes
- 251 E Broad St Unit 4
- 554 E Mcdonough St
- 212 Houston St
- 536 E Harris St
- 510 E Mcdonough St
- 234 Price St
- 517 E Liberty Ln
- 414 E Liberty St
- 407 E Mcdonough St
- 524 E Charlton St
- 405 E Liberty St
- 509 E York St
- 528 E Jones St
- 501 E Charlton St Unit E
- 501 E Charlton St Unit H
- 427 E York St
- 125 E Broad St Unit 2D
- 140 Habersham St
- 119 Houston St
- 117 Houston St
- 241 E Broad St
- 243 E Broad St
- 235 E Broad St
- 547 E Perry St
- 545 E Perry St
- 245 E Broad St
- 543 E Perry St
- 247 E Broad St
- 539 E Perry St
- 229 E Broad St
- 249 E Broad St
- 537 E Perry St
- 535 E Perry Ln
- 554 E Liberty St Unit 1
- 554 E Liberty St
- 544 E Perry St
- 552 E Liberty St
- 552 E Liberty St Unit A
- 552 E Liberty St Unit B
- 556 E Liberty St
Your Personal Tour Guide
Ask me questions while you tour the home.