Estimated Value: $411,000 - $492,000
3
Beds
3
Baths
1,810
Sq Ft
$247/Sq Ft
Est. Value
About This Home
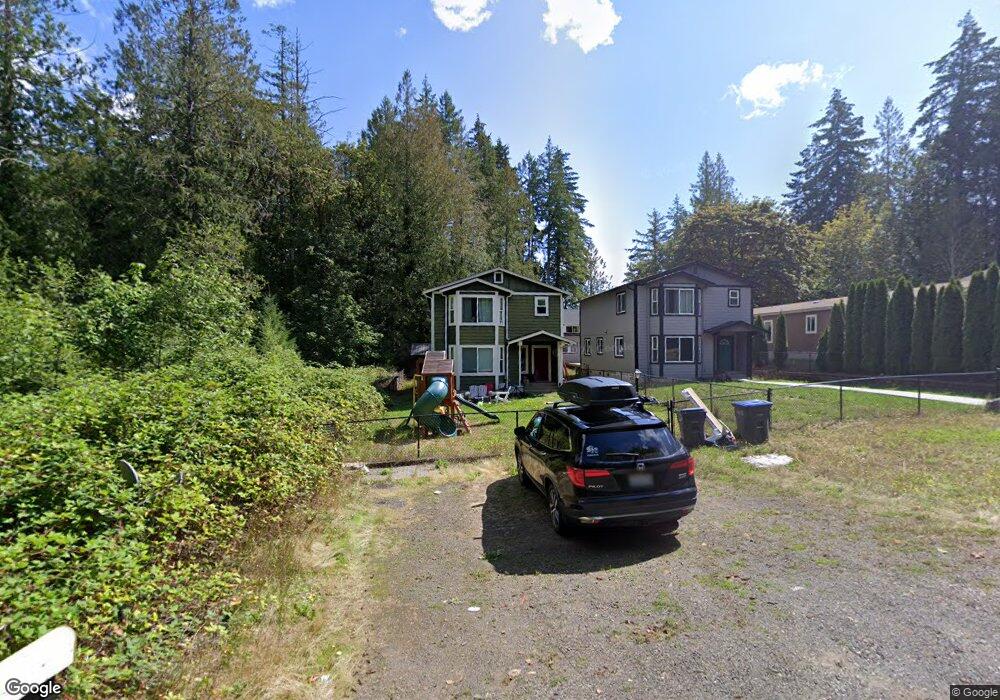
This home is located at 241 E Wheelwright St S, Allyn, WA 98524 and is currently estimated at $447,473, approximately $247 per square foot. 241 E Wheelwright St S is a home located in Mason County with nearby schools including North Mason Senior High School.
Ownership History
Date
Name
Owned For
Owner Type
Purchase Details
Closed on
Jun 16, 2017
Sold by
Landaker Rex and Landaker Janene
Bought by
Anderson Nicholas and Anderson Chelsea
Current Estimated Value
Home Financials for this Owner
Home Financials are based on the most recent Mortgage that was taken out on this home.
Original Mortgage
$245,160
Outstanding Balance
$203,601
Interest Rate
4.05%
Mortgage Type
VA
Estimated Equity
$243,872
Purchase Details
Closed on
Sep 27, 2007
Sold by
Porter Michael S and Porter Bryn E
Bought by
Landaker Rex and Landaker Janene
Home Financials for this Owner
Home Financials are based on the most recent Mortgage that was taken out on this home.
Original Mortgage
$219,990
Interest Rate
6.61%
Mortgage Type
New Conventional
Purchase Details
Closed on
Sep 22, 2006
Sold by
Scherfenberg Gary E
Bought by
Porter Michael S and Porter Bryn E
Home Financials for this Owner
Home Financials are based on the most recent Mortgage that was taken out on this home.
Original Mortgage
$220,000
Interest Rate
6.53%
Mortgage Type
Construction
Create a Home Valuation Report for This Property
The Home Valuation Report is an in-depth analysis detailing your home's value as well as a comparison with similar homes in the area
Home Values in the Area
Average Home Value in this Area
Purchase History
| Date | Buyer | Sale Price | Title Company |
|---|---|---|---|
| Anderson Nicholas | $240,281 | Old Republic National Title | |
| Landaker Rex | $220,000 | Land Title Co | |
| Porter Michael S | $34,500 | Land Title Co | |
| Porter Michael S | $34,500 | Land Title Co |
Source: Public Records
Mortgage History
| Date | Status | Borrower | Loan Amount |
|---|---|---|---|
| Open | Anderson Nicholas | $245,160 | |
| Previous Owner | Landaker Rex | $219,990 | |
| Previous Owner | Porter Michael S | $220,000 | |
| Previous Owner | Porter Michael S | $211,930 |
Source: Public Records
Tax History
| Year | Tax Paid | Tax Assessment Tax Assessment Total Assessment is a certain percentage of the fair market value that is determined by local assessors to be the total taxable value of land and additions on the property. | Land | Improvement |
|---|---|---|---|---|
| 2025 | $2,630 | $302,890 | $19,400 | $283,490 |
| 2024 | $2,630 | $340,180 | $20,420 | $319,760 |
| 2023 | $2,604 | $292,950 | $16,205 | $276,745 |
| 2022 | $3,726 | $414,165 | $14,755 | $399,410 |
| 2021 | $2,436 | $414,165 | $14,755 | $399,410 |
| 2020 | $2,539 | $280,835 | $13,415 | $267,420 |
| 2018 | $2,278 | $193,165 | $12,775 | $180,390 |
| 2017 | $2,019 | $193,095 | $12,705 | $180,390 |
| 2016 | $1,802 | $176,695 | $12,705 | $163,990 |
| 2015 | $1,879 | $158,230 | $5,685 | $152,545 |
| 2014 | -- | $167,160 | $5,750 | $161,410 |
| 2013 | -- | $155,610 | $4,840 | $150,770 |
Source: Public Records
Map
Nearby Homes
- 0 E Wheelwright St S
- 17991 E State Route 3
- 170 E Lakeland Dr
- 11 E Eberhart Ln
- 61 E Channel Dr
- 71 E Sullivan St
- 17 E Sellegren Rd
- 10 E Compass Ln
- 61 E Brady Loop
- 140 E Cedarland Ln
- 160 E Lakeland Way
- 201 E Country Club Dr
- 31 E Village View Dr
- 40 E Lakeshore Dr
- 0 E Sullivan St Unit NWM2494712
- 17717 E State Route 3
- 140 E Sullivan St
- 0 xxxx E Sullivan St
- 371 E Sullivan St
- 62 E North Bay Rd
- 241 E Wheelright St
- 241 E Wheelwright St
- 11 Blocks 82 83 84 Allyn Uga
- 261 E Wheelwright St
- 271 E Wheelwright St
- 83 E Wheelright St
- 200 E Wheelright St
- 1 E Wheelright St
- 0 E Wheelright St
- 211 E Wheelwright St
- 18158 E State Route 3
- 18183 E State Route 3
- 83 LT1-2-3 E Wheelwright St S
- 83 123 E Wheelwright St S
- 0 OFF E Wheelwright St S
- 83 E Wheelwright St S
- 0 xxx E Wheelwright St S
- 18187 E State Route 3
- 0 E191 Rainier Dr
- 18071 E State Route 3
Your Personal Tour Guide
Ask me questions while you tour the home.