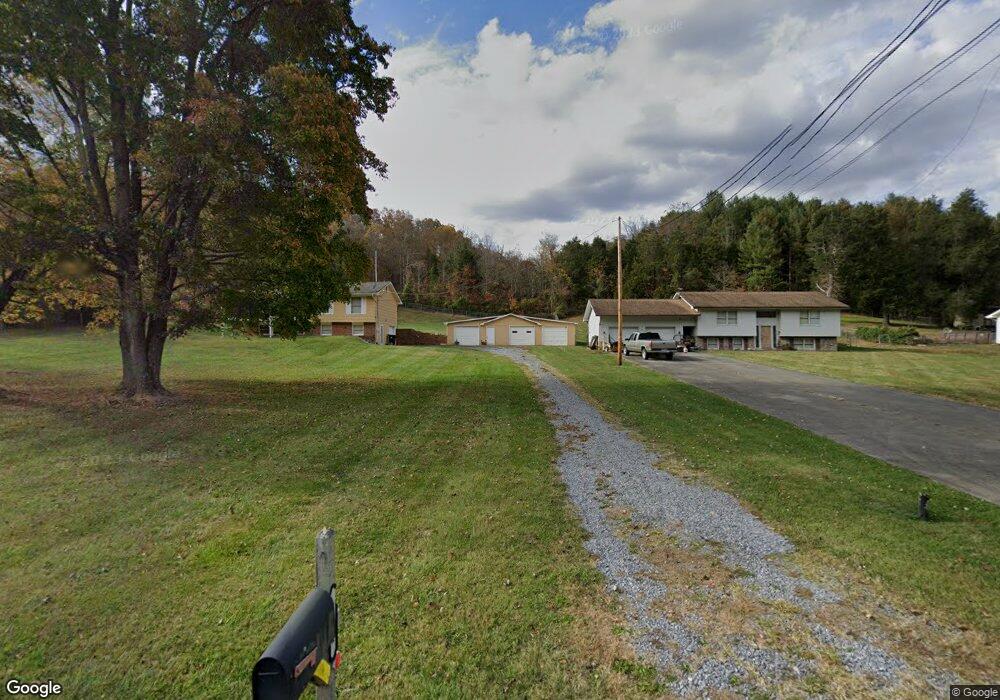
241 Horton Hwy Fall Branch, TN 37656
Estimated Value: $208,000 - $271,000
3
Beds
2
Baths
1,460
Sq Ft
$163/Sq Ft
Est. Value
About This Home
This home is located at 241 Horton Hwy, Fall Branch, TN 37656 and is currently estimated at $238,479, approximately $163 per square foot. 241 Horton Hwy is a home located in Washington County with nearby schools including Fall Branch Elementary School and Daniel Boone High School.
Ownership History
Date
Name
Owned For
Owner Type
Purchase Details
Closed on
Nov 17, 2021
Sold by
Accordino Cathleen L
Bought by
Mclaughlin Martin and Mclaughlin Lisa
Current Estimated Value
Purchase Details
Closed on
Feb 6, 2007
Bought by
Accordino Cathleen L
Purchase Details
Closed on
Sep 27, 2006
Sold by
Wallen Rickie J
Bought by
Wallen Rickie J
Purchase Details
Closed on
Sep 26, 2006
Bought by
Wallen Rickie J
Purchase Details
Closed on
Oct 6, 2004
Sold by
Gross William J
Bought by
Wallen Rickie J
Home Financials for this Owner
Home Financials are based on the most recent Mortgage that was taken out on this home.
Original Mortgage
$97,500
Interest Rate
5.71%
Purchase Details
Closed on
Apr 28, 1993
Bought by
Dykes Tommy L and Dykes Mary P
Create a Home Valuation Report for This Property
The Home Valuation Report is an in-depth analysis detailing your home's value as well as a comparison with similar homes in the area
Home Values in the Area
Average Home Value in this Area
Purchase History
| Date | Buyer | Sale Price | Title Company |
|---|---|---|---|
| Mclaughlin Martin | -- | Heritage Ttl & Closing Svcs | |
| Accordino Cathleen L | -- | -- | |
| Wallen Rickie J | -- | -- | |
| Wallen Rickie J | -- | -- | |
| Wallen Rickie J | $109,000 | -- | |
| Dykes Tommy L | $45,800 | -- |
Source: Public Records
Mortgage History
| Date | Status | Borrower | Loan Amount |
|---|---|---|---|
| Previous Owner | Dykes Tommy L | $97,500 |
Source: Public Records
Tax History Compared to Growth
Tax History
| Year | Tax Paid | Tax Assessment Tax Assessment Total Assessment is a certain percentage of the fair market value that is determined by local assessors to be the total taxable value of land and additions on the property. | Land | Improvement |
|---|---|---|---|---|
| 2024 | $723 | $42,300 | $3,050 | $39,250 |
| 2022 | $556 | $25,850 | $2,825 | $23,025 |
| 2021 | $556 | $25,850 | $2,825 | $23,025 |
| 2020 | $556 | $25,850 | $2,825 | $23,025 |
| 2019 | $627 | $25,850 | $2,825 | $23,025 |
| 2018 | $627 | $26,350 | $2,825 | $23,525 |
| 2017 | $627 | $26,350 | $2,825 | $23,525 |
| 2016 | $627 | $26,350 | $2,825 | $23,525 |
| 2015 | $522 | $26,350 | $2,825 | $23,525 |
| 2014 | $522 | $26,350 | $2,825 | $23,525 |
Source: Public Records
Map
Nearby Homes
- Tbd Oak Glen Cir
- 2145 Tennessee 93
- 160 Forrest Rd
- 1625 Highway 93
- 40 Spring Ln
- 176 Moulton Rd
- 255 Bank Dr
- 1415 Highway 93
- 263 Moulton Rd
- 825 Old Blairs Gap Rd
- 901 Old Blairs Gap Rd
- 106 Davis Rd
- 1340 Ryan Rd
- Tr 1 Joe R McCrary Rd
- 963 Big Ridge Rd
- 18525 Horton Hwy
- 704 Church Hill Dr
- 338 Citation Cir
- 206 Hialeah Dr
- 201 Derby Dr
- 239 Horton Hwy
- 229 Horton Hwy
- 247 Horton Hwy
- 249 Horton Hwy
- 223 Horton Hwy
- 265 Horton Hwy
- 260 Horton Hwy
- 254 Horton Hwy
- 218 Horton Hwy
- 271 Horton Hwy
- 214 Horton Hwy
- 207 Horton Hwy Unit 209
- 263 Horton Hwy Unit 265
- 304 Horton Hwy
- 275 Horton Hwy
- 295 Horton Hwy
- 303 Horton Hwy
- 289 Horton Hwy
- 137 Hawkins View Ln
- 245 Horton Hwy