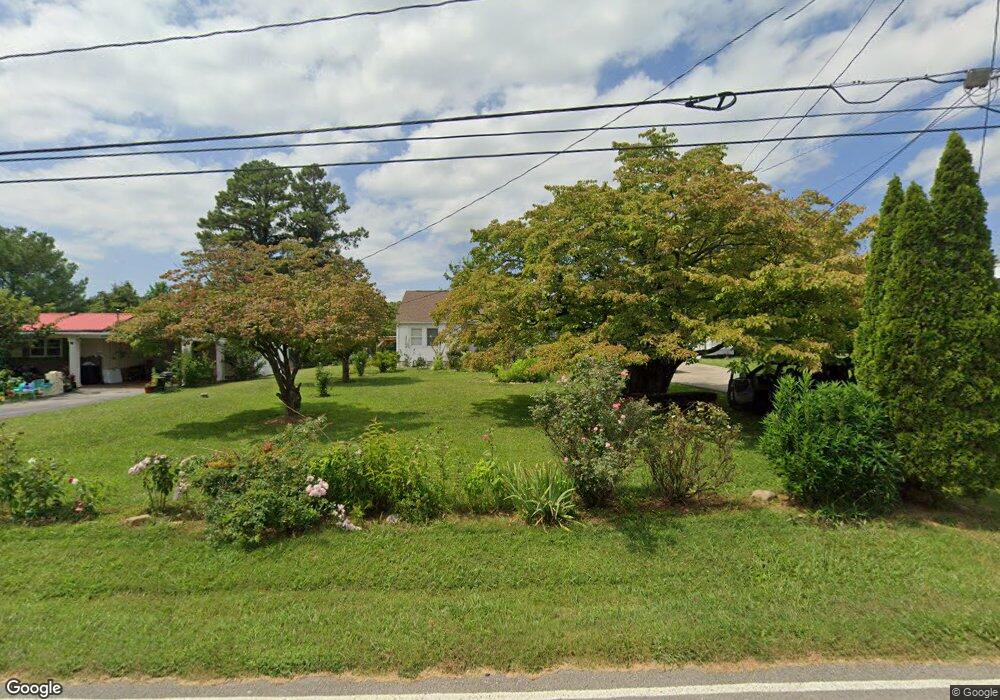
241 Moore St Sparta, TN 38583
Estimated Value: $110,419 - $220,000
3
Beds
2
Baths
1,236
Sq Ft
$143/Sq Ft
Est. Value
About This Home
This home is located at 241 Moore St, Sparta, TN 38583 and is currently estimated at $176,855, approximately $143 per square foot. 241 Moore St is a home located in White County with nearby schools including Findlay Elementary School, White County Middle School, and White County High School.
Ownership History
Date
Name
Owned For
Owner Type
Purchase Details
Closed on
Jun 22, 2009
Sold by
Weston James D
Bought by
Alverez Rodolfo
Current Estimated Value
Purchase Details
Closed on
Dec 28, 2004
Bought by
Weston James D and Weston Dorothy M
Home Financials for this Owner
Home Financials are based on the most recent Mortgage that was taken out on this home.
Original Mortgage
$55,100
Interest Rate
5.71%
Purchase Details
Closed on
May 20, 2002
Sold by
Burgess and Leslie
Bought by
Hill Marion E
Home Financials for this Owner
Home Financials are based on the most recent Mortgage that was taken out on this home.
Original Mortgage
$47,600
Interest Rate
6.92%
Purchase Details
Closed on
Jul 17, 1996
Sold by
Lige Burges
Bought by
Burgess Bryan E
Purchase Details
Closed on
Feb 23, 1989
Bought by
Burges Lige
Purchase Details
Closed on
Nov 5, 1941
Bought by
Burges Lige
Create a Home Valuation Report for This Property
The Home Valuation Report is an in-depth analysis detailing your home's value as well as a comparison with similar homes in the area
Home Values in the Area
Average Home Value in this Area
Purchase History
| Date | Buyer | Sale Price | Title Company |
|---|---|---|---|
| Alverez Rodolfo | $64,000 | -- | |
| Weston James D | $58,000 | -- | |
| Hill Marion E | $59,500 | -- | |
| Burgess Bryan E | $17,500 | -- | |
| Burges Lige | -- | -- | |
| Burges Lige | -- | -- |
Source: Public Records
Mortgage History
| Date | Status | Borrower | Loan Amount |
|---|---|---|---|
| Previous Owner | Burges Lige | $55,100 | |
| Previous Owner | Burges Lige | $47,600 | |
| Previous Owner | Burges Lige | $11,900 |
Source: Public Records
Tax History Compared to Growth
Tax History
| Year | Tax Paid | Tax Assessment Tax Assessment Total Assessment is a certain percentage of the fair market value that is determined by local assessors to be the total taxable value of land and additions on the property. | Land | Improvement |
|---|---|---|---|---|
| 2025 | -- | $33,525 | $0 | $0 |
| 2024 | -- | $17,375 | $3,500 | $13,875 |
| 2023 | $356 | $17,375 | $3,500 | $13,875 |
| 2022 | $516 | $17,375 | $3,500 | $13,875 |
| 2021 | $516 | $17,375 | $3,500 | $13,875 |
| 2020 | $516 | $17,375 | $3,500 | $13,875 |
| 2019 | $431 | $13,900 | $3,000 | $10,900 |
| 2018 | $431 | $13,900 | $3,000 | $10,900 |
| 2017 | $431 | $13,900 | $3,000 | $10,900 |
| 2016 | $431 | $13,900 | $3,000 | $10,900 |
| 2015 | $403 | $13,900 | $3,000 | $10,900 |
| 2014 | -- | $13,900 | $3,000 | $10,900 |
| 2013 | -- | $14,350 | $3,000 | $11,350 |
Source: Public Records
Map
Nearby Homes