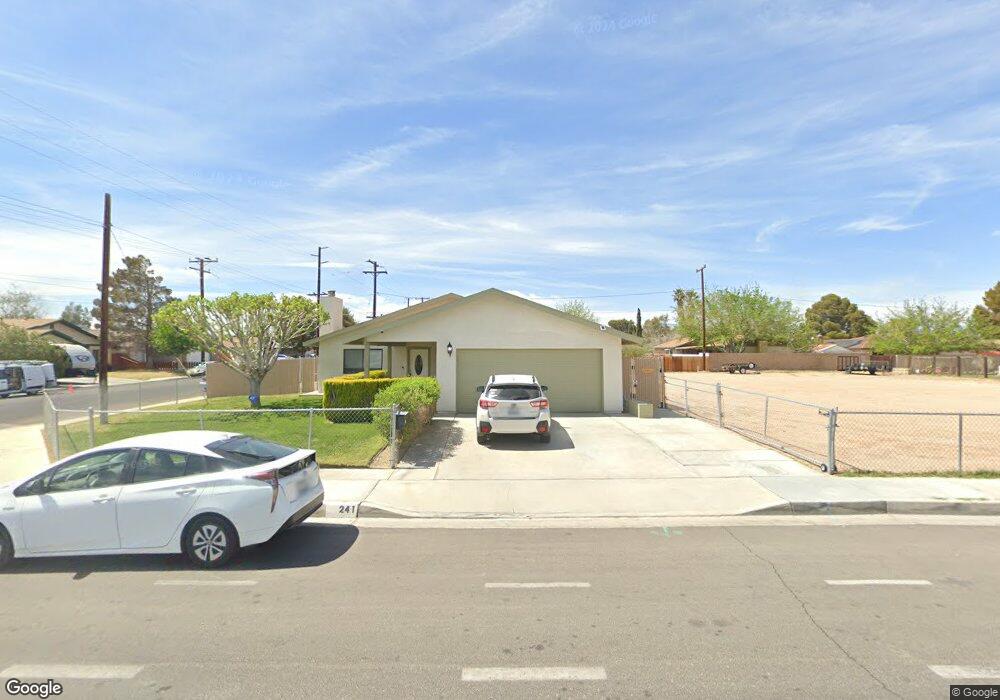
241 S Gateway Blvd Ridgecrest, CA 93555
Estimated Value: $232,000 - $281,000
1
Bed
1
Bath
300
Sq Ft
$856/Sq Ft
Est. Value
About This Home
This home is located at 241 S Gateway Blvd, Ridgecrest, CA 93555 and is currently estimated at $256,716, approximately $855 per square foot. 241 S Gateway Blvd is a home located in Kern County with nearby schools including Gateway Elementary School, James Monroe Middle School, and Burroughs High School.
Ownership History
Date
Name
Owned For
Owner Type
Purchase Details
Closed on
Nov 15, 2020
Sold by
Scovatti Timinado W and Scovatti Jeanne
Bought by
Bharwani Omar Shariff
Current Estimated Value
Home Financials for this Owner
Home Financials are based on the most recent Mortgage that was taken out on this home.
Original Mortgage
$217,580
Outstanding Balance
$193,264
Interest Rate
2.7%
Mortgage Type
VA
Estimated Equity
$63,452
Purchase Details
Closed on
Mar 1, 2002
Sold by
Va
Bought by
Scovotti Timinado W and Scovotti Jeanne L
Home Financials for this Owner
Home Financials are based on the most recent Mortgage that was taken out on this home.
Original Mortgage
$69,974
Interest Rate
6.99%
Purchase Details
Closed on
Jul 21, 1995
Sold by
Arsenault Daniel T
Bought by
Arsenault Mary K
Create a Home Valuation Report for This Property
The Home Valuation Report is an in-depth analysis detailing your home's value as well as a comparison with similar homes in the area
Home Values in the Area
Average Home Value in this Area
Purchase History
| Date | Buyer | Sale Price | Title Company |
|---|---|---|---|
| Bharwani Omar Shariff | $217,500 | Chicago Title Company | |
| Scovotti Timinado W | -- | -- | |
| Arsenault Mary K | -- | -- |
Source: Public Records
Mortgage History
| Date | Status | Borrower | Loan Amount |
|---|---|---|---|
| Open | Bharwani Omar Shariff | $217,580 | |
| Previous Owner | Scovotti Timinado W | $69,974 |
Source: Public Records
Tax History Compared to Growth
Tax History
| Year | Tax Paid | Tax Assessment Tax Assessment Total Assessment is a certain percentage of the fair market value that is determined by local assessors to be the total taxable value of land and additions on the property. | Land | Improvement |
|---|---|---|---|---|
| 2025 | $3,022 | $235,427 | $32,472 | $202,955 |
| 2024 | $2,931 | $230,812 | $31,836 | $198,976 |
| 2023 | $2,931 | $226,287 | $31,212 | $195,075 |
| 2022 | $2,871 | $221,850 | $30,600 | $191,250 |
| 2021 | $2,868 | $217,500 | $30,000 | $187,500 |
| 2020 | $1,180 | $72,970 | $7,286 | $65,684 |
| 2019 | $1,164 | $72,970 | $7,286 | $65,684 |
| 2018 | $1,147 | $70,139 | $7,004 | $63,135 |
| 2017 | $1,143 | $68,765 | $6,867 | $61,898 |
| 2016 | $1,101 | $67,418 | $6,733 | $60,685 |
| 2015 | $1,081 | $66,406 | $6,632 | $59,774 |
| 2014 | $961 | $65,107 | $6,503 | $58,604 |
Source: Public Records
Map
Nearby Homes
- 320 S Gateway Blvd
- 811 White Oak Dr
- 1006 E Church Ave
- 300 S Lincoln St
- 645 E Church Ave
- 0 S Gateway Blvd
- 1 E Ridgecrest Blvd
- 314 Reese St
- 112 Valley St
- 322 Reese St
- 436 Fountain St
- 632-A Commercial
- 2005 S American St
- 217 S American St
- 601 E Church Ave
- 228 S Greenlawn St
- 0 E Ridgecrest Blvd
- 613 Heatherglen Dr
- 625 Cottonwood Dr
- 142 Chambers St Unit K
- 241 S Gateway Blvd Unit 1
- 240 S Orchard St
- 236 S Orchard St
- 837 E Church Ave
- 833 E Church Ave
- 229 S Gateway Blvd
- 229 W Ridgecrest Blvd
- 232 S Orchard St
- 829 E Church Ave
- 236 S Gateway Blvd
- 225 S Gateway Blvd
- 825 E Church Ave
- 226 S Orchard St
- 828 Walker Ln
- 906 E Church Ave
- 832 Walker Ln
- 300 S Gateway Blvd
- 221 S Gateway Blvd
- 821 E Church Ave
- 824 Walker Ln