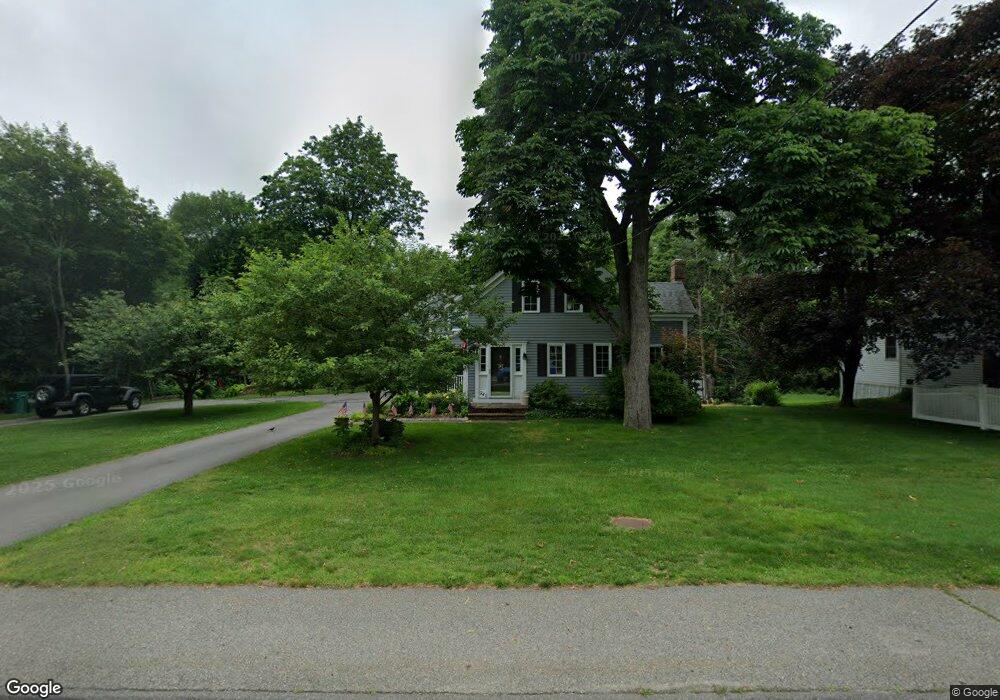
241 S Main St Mansfield, MA 02048
Estimated Value: $673,540 - $849,000
4
Beds
2
Baths
2,252
Sq Ft
$352/Sq Ft
Est. Value
About This Home
This home is located at 241 S Main St, Mansfield, MA 02048 and is currently estimated at $793,385, approximately $352 per square foot. 241 S Main St is a home located in Bristol County with nearby schools including Everett W. Robinson Elementary School, Jordan/Jackson Elementary School, and Harold L. Qualters Middle School.
Ownership History
Date
Name
Owned For
Owner Type
Purchase Details
Closed on
Jul 19, 1996
Sold by
Roberts James A
Bought by
Kelleya Douglas S and Kelley Amy E
Current Estimated Value
Home Financials for this Owner
Home Financials are based on the most recent Mortgage that was taken out on this home.
Original Mortgage
$120,000
Interest Rate
8.28%
Mortgage Type
Purchase Money Mortgage
Create a Home Valuation Report for This Property
The Home Valuation Report is an in-depth analysis detailing your home's value as well as a comparison with similar homes in the area
Home Values in the Area
Average Home Value in this Area
Purchase History
| Date | Buyer | Sale Price | Title Company |
|---|---|---|---|
| Kelleya Douglas S | $150,000 | -- |
Source: Public Records
Mortgage History
| Date | Status | Borrower | Loan Amount |
|---|---|---|---|
| Open | Kelleya Douglas S | $298,127 | |
| Closed | Kelleya Douglas S | $25,000 | |
| Closed | Kelleya Douglas S | $145,000 | |
| Closed | Kelleya Douglas S | $120,000 |
Source: Public Records
Tax History Compared to Growth
Tax History
| Year | Tax Paid | Tax Assessment Tax Assessment Total Assessment is a certain percentage of the fair market value that is determined by local assessors to be the total taxable value of land and additions on the property. | Land | Improvement |
|---|---|---|---|---|
| 2025 | $9,220 | $700,100 | $239,900 | $460,200 |
| 2024 | $7,611 | $563,800 | $239,900 | $323,900 |
| 2023 | $6,853 | $486,400 | $239,900 | $246,500 |
| 2022 | $6,604 | $435,300 | $222,100 | $213,200 |
| 2021 | $5,241 | $467,900 | $194,400 | $273,500 |
| 2020 | $6,437 | $419,100 | $185,100 | $234,000 |
| 2019 | $6,911 | $454,100 | $154,200 | $299,900 |
| 2018 | $7,231 | $473,200 | $147,000 | $326,200 |
| 2017 | $6,175 | $411,100 | $142,800 | $268,300 |
| 2016 | $5,662 | $367,400 | $136,000 | $231,400 |
| 2015 | $5,695 | $367,400 | $136,000 | $231,400 |
Source: Public Records
Map
Nearby Homes
- 28 Court St
- 414 Branch St
- 150 Rumford Ave Unit 110
- 460 Ware St
- 442 Ware St
- 22 Pleasant St Unit C
- 166 Chauncy St
- 82 Brook St
- 277 Central St
- 28 Angell St
- 44 Angell St Unit 44
- 18 Columbine Rd
- 15 Reservoir St Unit 44
- 619 N Main St
- 631 East St Unit E203
- 15 Rock Ln
- 356 Central St
- Lot 3 Birch Ln
- 212 Mill St
- 4 Buckskin Dr