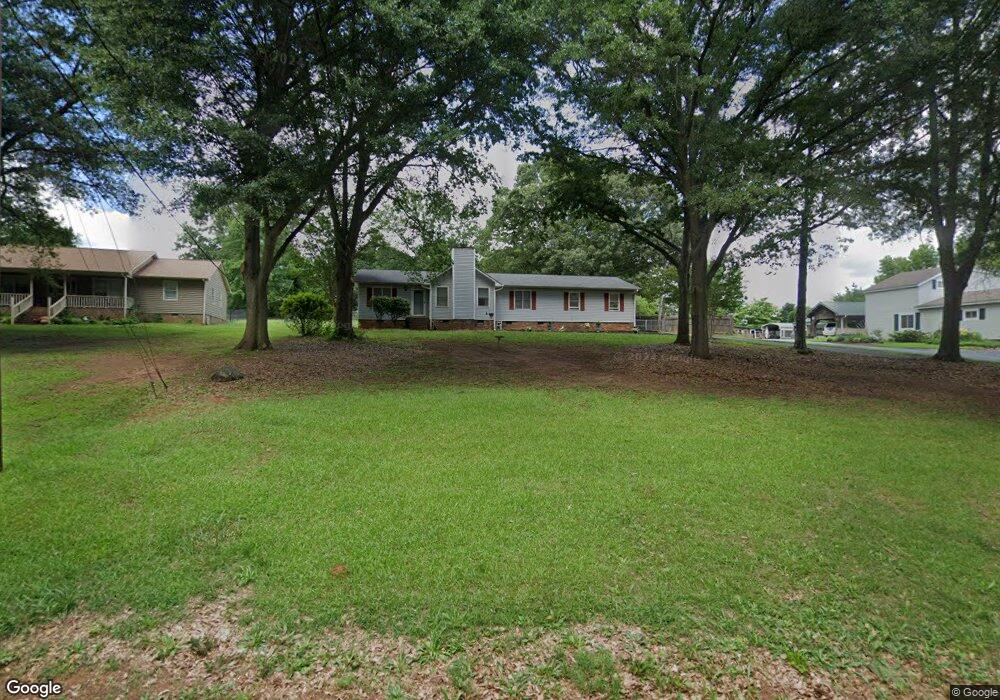
241 Spring St Boiling Springs, SC 29316
Estimated Value: $243,000 - $281,000
3
Beds
2
Baths
1,507
Sq Ft
$173/Sq Ft
Est. Value
About This Home
This home is located at 241 Spring St, Boiling Springs, SC 29316 and is currently estimated at $261,035, approximately $173 per square foot. 241 Spring St is a home located in Spartanburg County with nearby schools including Boiling Springs Middle School, Boiling Springs High School, and Spartanburg Christian Academy.
Ownership History
Date
Name
Owned For
Owner Type
Purchase Details
Closed on
Jan 14, 2010
Sold by
Blackwood Preston S
Bought by
Blackwood Donna S
Current Estimated Value
Purchase Details
Closed on
Mar 17, 2003
Sold by
Blackwood Donna R
Bought by
Blackwood Preston S
Purchase Details
Closed on
Oct 31, 2001
Sold by
Thomas Robert Lee and Thomas Debra A
Bought by
Blackwood Donna R
Create a Home Valuation Report for This Property
The Home Valuation Report is an in-depth analysis detailing your home's value as well as a comparison with similar homes in the area
Home Values in the Area
Average Home Value in this Area
Purchase History
| Date | Buyer | Sale Price | Title Company |
|---|---|---|---|
| Blackwood Donna S | -- | -- | |
| Blackwood Preston S | -- | -- | |
| Blackwood Donna R | $107,400 | -- |
Source: Public Records
Tax History Compared to Growth
Tax History
| Year | Tax Paid | Tax Assessment Tax Assessment Total Assessment is a certain percentage of the fair market value that is determined by local assessors to be the total taxable value of land and additions on the property. | Land | Improvement |
|---|---|---|---|---|
| 2025 | $1,010 | $5,841 | $853 | $4,988 |
| 2024 | $1,010 | $5,841 | $853 | $4,988 |
| 2023 | $1,010 | $5,841 | $853 | $4,988 |
| 2022 | $900 | $5,079 | $672 | $4,407 |
| 2021 | $899 | $5,079 | $672 | $4,407 |
| 2020 | $884 | $5,079 | $672 | $4,407 |
| 2019 | $884 | $5,079 | $672 | $4,407 |
| 2018 | $864 | $5,079 | $672 | $4,407 |
| 2017 | $762 | $4,416 | $680 | $3,736 |
| 2016 | $767 | $4,416 | $680 | $3,736 |
| 2015 | $760 | $4,400 | $680 | $3,720 |
| 2014 | $749 | $4,960 | $680 | $4,280 |
Source: Public Records
Map
Nearby Homes
- 6011 Beasley Ct
- 6007 Beasley Ct
- 6014 Beasley Ct
- 4038 Hoskins Dr
- 4033 Hoskins Dr
- 4030 Hoskins Dr
- 4026 Hoskins Dr
- 5006 Atkins Way
- 5002 Atkins Way
- 5005 Atkins Way
- 5001 Atkins Way
- Liston Plan at Sparrow Creek - Reserve
- Valen Plan at Sparrow Creek - Summit
- Winthrop Plan at Sparrow Creek - Summit
- Heston Plan at Sparrow Creek - Summit
- Frazier Plan at Sparrow Creek - Reserve
- Medina Plan at Sparrow Creek - Summit
- Tilden Plan at Sparrow Creek - Summit
- Dempsey Plan at Sparrow Creek - Reserve
- 618 Fawn Branch Trail