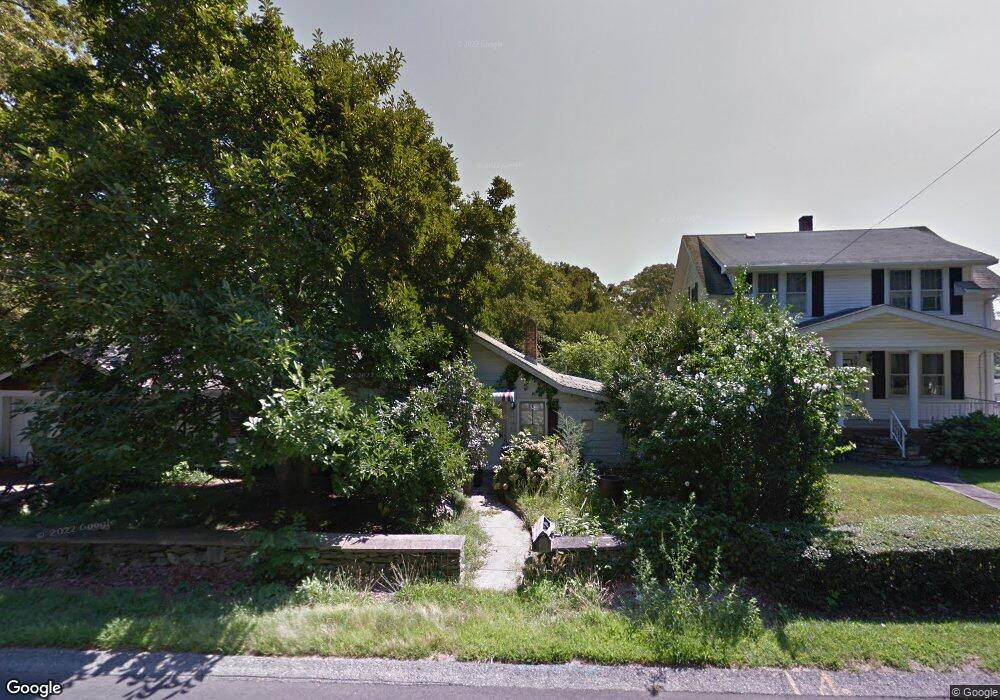
241 Swansom Rd Swansea, MA 02777
Northeast Swansea NeighborhoodEstimated Value: $397,000 - $483,000
3
Beds
1
Bath
1,200
Sq Ft
$361/Sq Ft
Est. Value
About This Home
This home is located at 241 Swansom Rd, Swansea, MA 02777 and is currently estimated at $433,564, approximately $361 per square foot. 241 Swansom Rd is a home located in Bristol County with nearby schools including Joseph Case High School, Swansea Wood School, and SCEC Life Academy.
Ownership History
Date
Name
Owned For
Owner Type
Purchase Details
Closed on
Jul 1, 2005
Sold by
Brayton Ave Dev Corp I
Bought by
Morrow David and Morrow Kemberly
Current Estimated Value
Home Financials for this Owner
Home Financials are based on the most recent Mortgage that was taken out on this home.
Original Mortgage
$359,500
Outstanding Balance
$188,511
Interest Rate
5.73%
Mortgage Type
Purchase Money Mortgage
Estimated Equity
$245,053
Purchase Details
Closed on
Feb 15, 1996
Sold by
Est Morrow Mary V and Morrow Donald M
Bought by
Morrow Kimberly L and Marchand Todd L
Home Financials for this Owner
Home Financials are based on the most recent Mortgage that was taken out on this home.
Original Mortgage
$63,000
Interest Rate
6.99%
Mortgage Type
Purchase Money Mortgage
Create a Home Valuation Report for This Property
The Home Valuation Report is an in-depth analysis detailing your home's value as well as a comparison with similar homes in the area
Home Values in the Area
Average Home Value in this Area
Purchase History
| Date | Buyer | Sale Price | Title Company |
|---|---|---|---|
| Morrow David | $404,150 | -- | |
| Morrow Kimberly L | $70,000 | -- |
Source: Public Records
Mortgage History
| Date | Status | Borrower | Loan Amount |
|---|---|---|---|
| Open | Morrow David | $359,500 | |
| Previous Owner | Morrow Kimberly L | $63,000 | |
| Previous Owner | Morrow Kimberly L | $66,500 |
Source: Public Records
Tax History Compared to Growth
Tax History
| Year | Tax Paid | Tax Assessment Tax Assessment Total Assessment is a certain percentage of the fair market value that is determined by local assessors to be the total taxable value of land and additions on the property. | Land | Improvement |
|---|---|---|---|---|
| 2025 | $3,767 | $316,000 | $156,000 | $160,000 |
| 2024 | $3,765 | $314,000 | $156,000 | $158,000 |
| 2023 | $3,490 | $265,800 | $114,200 | $151,600 |
| 2022 | $3,429 | $238,300 | $103,800 | $134,500 |
| 2021 | $3,229 | $206,600 | $103,800 | $102,800 |
| 2020 | $3,219 | $206,600 | $103,800 | $102,800 |
| 2019 | $3,028 | $195,200 | $92,400 | $102,800 |
| 2018 | $2,905 | $190,100 | $90,800 | $99,300 |
| 2017 | $2,525 | $190,100 | $90,800 | $99,300 |
| 2016 | $2,439 | $180,400 | $78,500 | $101,900 |
| 2015 | $2,233 | $170,100 | $78,500 | $91,600 |
| 2014 | $2,199 | $171,300 | $78,500 | $92,800 |
Source: Public Records
Map
Nearby Homes
- 0 Bark St Unit 1342599
- 0 Bark St Unit 73152576
- 265 Stevens Rd
- 33 Rhinecliffe Rd
- 51 Linden Dr
- 58 Randall Ave
- 197 Alberta Ave
- 745 Bark St
- 34 Base Lodge Ln
- 80 Meadow Ln
- 66 Meadow Ln
- 60 Aetna St
- 34 Doherty Ave
- 1496 Riverside Ave
- 54 Grant Ave
- 95 Brookside Rd
- 24 Front St
- 30 Front St
- 675 Lees River Ave
- 2396 Riverside Ave