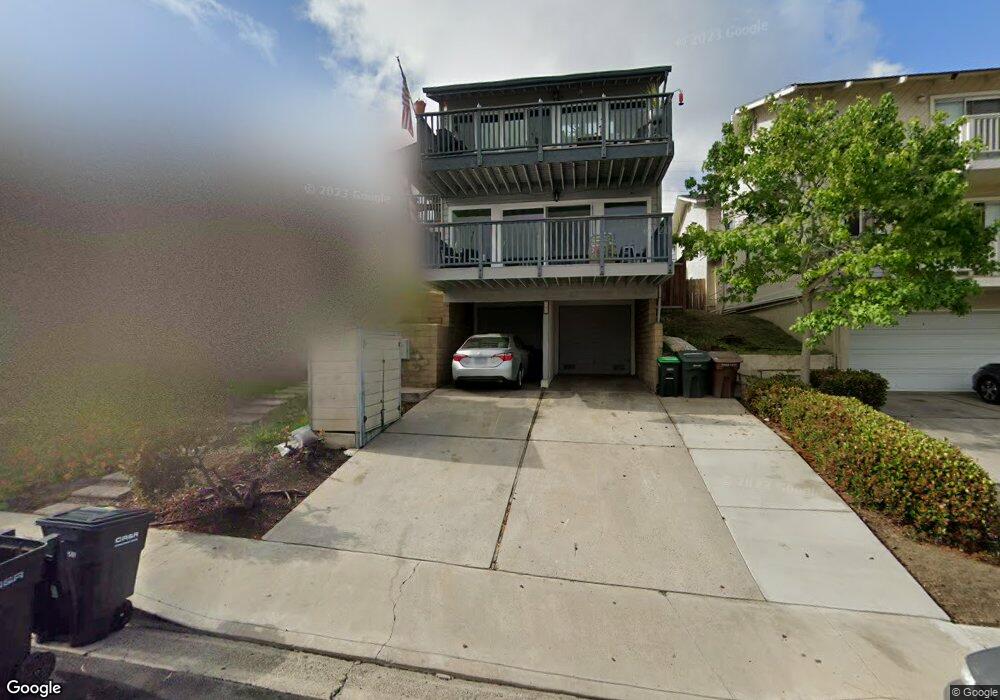
241 W El Portal Unit 2 San Clemente, CA 92672
Central San Clemente NeighborhoodEstimated Value: $1,370,000 - $1,493,354
3
Beds
2
Baths
1,563
Sq Ft
$899/Sq Ft
Est. Value
About This Home
This home is located at 241 W El Portal Unit 2, San Clemente, CA 92672 and is currently estimated at $1,405,839, approximately $899 per square foot. 241 W El Portal Unit 2 is a home located in Orange County with nearby schools including Las Palmas Elementary School, Bernice Ayer Middle School, and San Clemente High School.
Ownership History
Date
Name
Owned For
Owner Type
Purchase Details
Closed on
Mar 19, 2025
Sold by
Lee Carter W
Bought by
Smith Scott A and Smith Jacquelin E
Current Estimated Value
Home Financials for this Owner
Home Financials are based on the most recent Mortgage that was taken out on this home.
Original Mortgage
$1,080,000
Outstanding Balance
$1,074,494
Interest Rate
6.89%
Mortgage Type
New Conventional
Estimated Equity
$331,345
Purchase Details
Closed on
Dec 20, 2002
Sold by
Grunburg Richard
Bought by
Lee Carter W
Home Financials for this Owner
Home Financials are based on the most recent Mortgage that was taken out on this home.
Original Mortgage
$304,000
Interest Rate
5.83%
Purchase Details
Closed on
Nov 18, 1999
Sold by
Garrison Philip W and Garrison Sharon L
Bought by
Grunburg Richard A
Home Financials for this Owner
Home Financials are based on the most recent Mortgage that was taken out on this home.
Original Mortgage
$194,750
Interest Rate
8.14%
Create a Home Valuation Report for This Property
The Home Valuation Report is an in-depth analysis detailing your home's value as well as a comparison with similar homes in the area
Home Values in the Area
Average Home Value in this Area
Purchase History
| Date | Buyer | Sale Price | Title Company |
|---|---|---|---|
| Smith Scott A | $1,350,000 | Stewart Title Guaranty Company | |
| Lee Carter W | $380,000 | American Title Co | |
| Grunburg Richard A | $205,000 | Commonwealth Land Title |
Source: Public Records
Mortgage History
| Date | Status | Borrower | Loan Amount |
|---|---|---|---|
| Open | Smith Scott A | $1,080,000 | |
| Previous Owner | Lee Carter W | $304,000 | |
| Previous Owner | Grunburg Richard A | $194,750 |
Source: Public Records
Tax History Compared to Growth
Tax History
| Year | Tax Paid | Tax Assessment Tax Assessment Total Assessment is a certain percentage of the fair market value that is determined by local assessors to be the total taxable value of land and additions on the property. | Land | Improvement |
|---|---|---|---|---|
| 2025 | $5,475 | $550,357 | $400,921 | $149,436 |
| 2024 | $5,475 | $539,566 | $393,060 | $146,506 |
| 2023 | $5,359 | $528,987 | $385,353 | $143,634 |
| 2022 | $5,257 | $518,615 | $377,797 | $140,818 |
| 2021 | $5,156 | $508,447 | $370,390 | $138,057 |
| 2020 | $5,105 | $503,234 | $366,592 | $136,642 |
| 2019 | $5,005 | $493,367 | $359,404 | $133,963 |
| 2018 | $4,909 | $483,694 | $352,357 | $131,337 |
| 2017 | $4,813 | $474,210 | $345,448 | $128,762 |
| 2016 | $4,721 | $464,912 | $338,674 | $126,238 |
| 2015 | $4,650 | $457,929 | $333,587 | $124,342 |
| 2014 | $4,561 | $448,959 | $327,052 | $121,907 |
Source: Public Records
Map
Nearby Homes
- 911 Buena Vista Unit 1
- 229 W Canada
- 244 W Escalones
- 221 Avenida de la Grulla
- 228 W Mariposa
- 210 W Escalones Unit A,B,C
- 1412 Buena Vista Unit 8
- 162 Avenida Florencia Unit 2
- 214 W Mariposa Unit B
- 227 W El Portal
- 1507 Calle Sacramento Unit B
- 137 Avenida Florencia
- 255 W Marquita Unit 1
- 412 Arenoso Ln Unit 104
- 1531 Buena Vista
- 121 Boca de la Playa Unit 1
- 309 W Avenida Palizada
- 423 Avenida Granada Unit 54
- 227 Avenida Serra
- 163 Calle Redondel
- 241 W El Portal
- 239 W El Portal Unit 2
- 239 W El Portal Unit A
- 241 W El Portal Unit B
- 241 W El Portal Unit A
- 239 W El Portal
- 237 W El Portal Unit A
- 237 W El Portal
- 243 W El Portal
- 235 W El Portal
- 248 Avenida Del Poniente Unit C
- 248 Avenida Del Poniente Unit B
- 248 Avenida Del Poniente Unit A
- 248 Avenida Del Poniente
- 246 Avenida Del Poniente
- 250 Avenida Del Poniente Unit B
- 250 Avenida Del Poniente Unit A
- 250 Avenida Del Poniente Unit C
- 250 Avenida Del Poniente
- 244 Avenida Del Poniente Unit B Upper