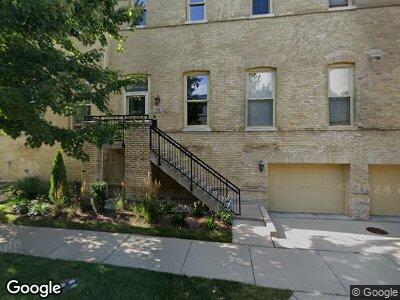
241 Whistler Rd Unit 241 Highland Park, IL 60035
Estimated Value: $590,000 - $645,000
3
Beds
3
Baths
1,768
Sq Ft
$353/Sq Ft
Est. Value
About This Home
This home is located at 241 Whistler Rd Unit 241, Highland Park, IL 60035 and is currently estimated at $624,218, approximately $353 per square foot. 241 Whistler Rd Unit 241 is a home located in Lake County with nearby schools including Wayne Thomas Elementary School, Northwood Jr High School, and Highland Park High School.
Ownership History
Date
Name
Owned For
Owner Type
Purchase Details
Closed on
May 18, 2016
Sold by
Miara Mark S and Miara Monika J
Bought by
Lorelei Mm Trust
Current Estimated Value
Purchase Details
Closed on
Dec 27, 2007
Sold by
Chicago Title Land Trust Co
Bought by
Miara Mark S and Miara Monika J
Home Financials for this Owner
Home Financials are based on the most recent Mortgage that was taken out on this home.
Original Mortgage
$46,000
Interest Rate
5.95%
Mortgage Type
Stand Alone Second
Purchase Details
Closed on
Oct 27, 1999
Sold by
Tfs Building 103-105 Llc
Bought by
American National Bk & Tr Co Of Chicago and Trust #125201-02
Home Financials for this Owner
Home Financials are based on the most recent Mortgage that was taken out on this home.
Original Mortgage
$258,000
Interest Rate
9.55%
Mortgage Type
Purchase Money Mortgage
Create a Home Valuation Report for This Property
The Home Valuation Report is an in-depth analysis detailing your home's value as well as a comparison with similar homes in the area
Home Values in the Area
Average Home Value in this Area
Purchase History
| Date | Buyer | Sale Price | Title Company |
|---|---|---|---|
| Lorelei Mm Trust | -- | Attorney | |
| Miara Mark S | $460,000 | None Available | |
| American National Bk & Tr Co Of Chicago | $345,000 | -- |
Source: Public Records
Mortgage History
| Date | Status | Borrower | Loan Amount |
|---|---|---|---|
| Open | Miara Mark S | $368,000 | |
| Closed | Miara Mark S | $46,000 | |
| Closed | Miara Mark S | $368,000 | |
| Previous Owner | American National Bk & Tr Co Of Chicago | $258,000 |
Source: Public Records
Tax History Compared to Growth
Tax History
| Year | Tax Paid | Tax Assessment Tax Assessment Total Assessment is a certain percentage of the fair market value that is determined by local assessors to be the total taxable value of land and additions on the property. | Land | Improvement |
|---|---|---|---|---|
| 2023 | $12,453 | $143,975 | $11,443 | $132,532 |
| 2022 | $12,453 | $138,287 | $12,571 | $125,716 |
| 2021 | $11,490 | $133,675 | $12,152 | $121,523 |
| 2020 | $11,118 | $133,675 | $12,152 | $121,523 |
| 2019 | $10,741 | $133,050 | $12,095 | $120,955 |
| 2018 | $10,841 | $142,283 | $13,235 | $129,048 |
| 2017 | $10,672 | $141,463 | $13,159 | $128,304 |
| 2016 | $10,302 | $134,676 | $12,528 | $122,148 |
| 2015 | $9,524 | $125,129 | $11,640 | $113,489 |
| 2014 | $7,737 | $100,459 | $11,481 | $88,978 |
| 2012 | $7,535 | $101,045 | $11,548 | $89,497 |
Source: Public Records
Map
Nearby Homes
- 204 Leonard Wood S Unit 204
- 194 Whistler Rd Unit 301
- 314 Whistler Rd
- 3507 Bradley Ct
- 27 Rienzi Ln
- 0 Patten Rd
- 306 Ashland Ave
- 3150 Warbler Place
- 2528 Hidden Oak (Lot 6) Cir
- 540 Green Bay Rd
- 538 Green Bay Rd
- 1171 Beverly Place
- 805 Longwood Dr
- 2936 Warbler Place
- 595 Circle Ln
- 328 Oak Terrace Ave
- 715 Linden Ave
- 417 Temple Ave
- 317 Highwood Ave
- 238 Jeffreys Place
- 241 Whistler Rd Unit 105D
- 241 Whistler Rd Unit 241
- 241 Whistler Rd Unit N
- 235 Whistler Rd Unit 105E
- 245 Whistler Rd Unit 105C
- 251 Whistler Rd Unit 105B
- 242 Leonard Wood S Unit 212
- 242 Leonard Wood S Unit 112
- 242 Leonard Wood S Unit 111
- 255 Whistler Rd Unit 105A
- 248 Leonard Wood S Unit 210
- 248 Leonard Wood S Unit 209
- 248 Leonard Wood S Unit 110
- 248 Leonard Wood S Unit 109
- 238 Leonard Wood S
- 238 Leonard Wood S Unit 213
- 238 Leonard Wood S Unit 113
- 234 Leonard Wood S Unit 114
- 261 Whistler Rd Unit 104D
- 240 Whistler Rd Unit 2F