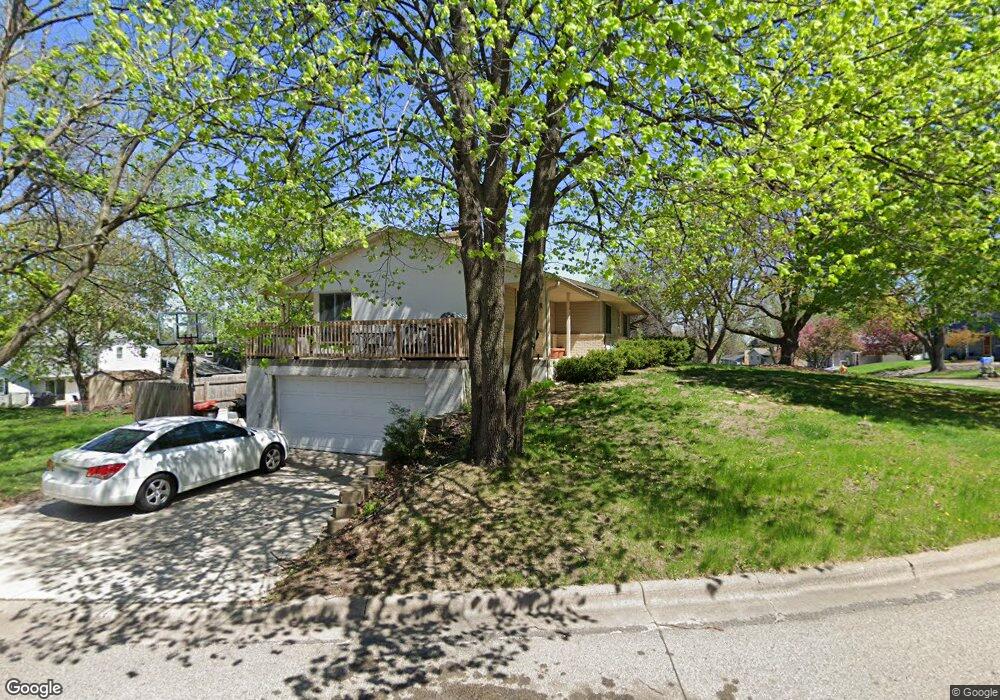
2410 2410 Francis St South St. Paul, MN 55075
Estimated Value: $382,000 - $390,000
4
Beds
2
Baths
1,464
Sq Ft
$263/Sq Ft
Est. Value
About This Home
This home is located at 2410 2410 Francis St, South St. Paul, MN 55075 and is currently estimated at $384,997, approximately $262 per square foot. 2410 2410 Francis St is a home located in Dakota County with nearby schools including Lincoln Center Elementary, South St. Paul Secondary, and Academic Arts High School.
Ownership History
Date
Name
Owned For
Owner Type
Purchase Details
Closed on
Jun 26, 2014
Sold by
Wagner Kenneth Kenneth
Bought by
Dwelle Jayson Jayson
Current Estimated Value
Home Financials for this Owner
Home Financials are based on the most recent Mortgage that was taken out on this home.
Original Mortgage
$201,875
Outstanding Balance
$153,653
Interest Rate
4.14%
Estimated Equity
$231,344
Purchase Details
Closed on
Jul 17, 2013
Sold by
Roberts Marcia E and Roberts Ralph
Bought by
Wagner Kenneth D
Purchase Details
Closed on
Jul 11, 2011
Sold by
Wagner Kenneth D
Bought by
Roberts Marcia E
Home Financials for this Owner
Home Financials are based on the most recent Mortgage that was taken out on this home.
Original Mortgage
$250,000
Interest Rate
6.5%
Mortgage Type
Seller Take Back
Create a Home Valuation Report for This Property
The Home Valuation Report is an in-depth analysis detailing your home's value as well as a comparison with similar homes in the area
Home Values in the Area
Average Home Value in this Area
Purchase History
| Date | Buyer | Sale Price | Title Company |
|---|---|---|---|
| Dwelle Jayson Jayson | $212,500 | -- | |
| Wagner Kenneth D | -- | None Available | |
| Roberts Marcia E | $250,000 | None Available |
Source: Public Records
Mortgage History
| Date | Status | Borrower | Loan Amount |
|---|---|---|---|
| Open | Dwelle Jayson Jayson | $201,875 | |
| Previous Owner | Roberts Marcia E | $250,000 |
Source: Public Records
Tax History Compared to Growth
Tax History
| Year | Tax Paid | Tax Assessment Tax Assessment Total Assessment is a certain percentage of the fair market value that is determined by local assessors to be the total taxable value of land and additions on the property. | Land | Improvement |
|---|---|---|---|---|
| 2024 | $5,466 | $357,200 | $90,900 | $266,300 |
| 2023 | $5,466 | $366,500 | $91,400 | $275,100 |
| 2022 | $4,586 | $349,900 | $91,400 | $258,500 |
| 2021 | $4,448 | $307,700 | $79,500 | $228,200 |
| 2020 | $4,370 | $292,100 | $75,700 | $216,400 |
| 2019 | $3,985 | $292,500 | $72,100 | $220,400 |
| 2018 | $3,909 | $255,000 | $65,500 | $189,500 |
| 2017 | $3,599 | $239,700 | $62,400 | $177,300 |
| 2016 | $3,064 | $221,400 | $56,800 | $164,600 |
| 2015 | $2,909 | $194,930 | $49,510 | $145,420 |
| 2014 | -- | $196,238 | $49,563 | $146,675 |
| 2013 | -- | $190,800 | $47,500 | $143,300 |
Source: Public Records
Map
Nearby Homes
- 119 22nd Ave S
- 217 20th Ave S
- 210 19th Ave S
- 416 20th Ave S
- 114 20th Ave N
- 126 20th Ave N
- 4552 Blaylock Way
- 4570 Blaylock Way Unit 4202
- 4543 Bloomberg Cir
- 127 16th Ave S
- 241 15th Ave S
- 4739 Blaine Ave Unit 506
- 2205 Acorn Ln
- 4825 Babcock Trail Unit 2005
- 4680 Bloomberg Ln
- 339 14th Ave S
- 436 17th Ave N
- 425 16th Ave N
- 236 11th Ave S
- 116 11th Ave S
- 2410 Francis St
- 2400 Francis St
- 2411 Anthony St
- 2330 Francis St
- 2401 Anthony St
- 2451 Francis St
- 2441 Francis St
- 2421 2421 Francis-Street-
- 2431 Francis St
- 2331 Anthony St
- 2450 2450 Anthony-Street-
- 2450 2450 Anthony St
- 2450 Anthony St
- 2411 Francis St
- 2421 Francis St
- 2320 Francis St
- 2401 Francis St
- 2401 2401 Francis-Street-
- 2401 2401 Francis St
- 2321 Anthony St