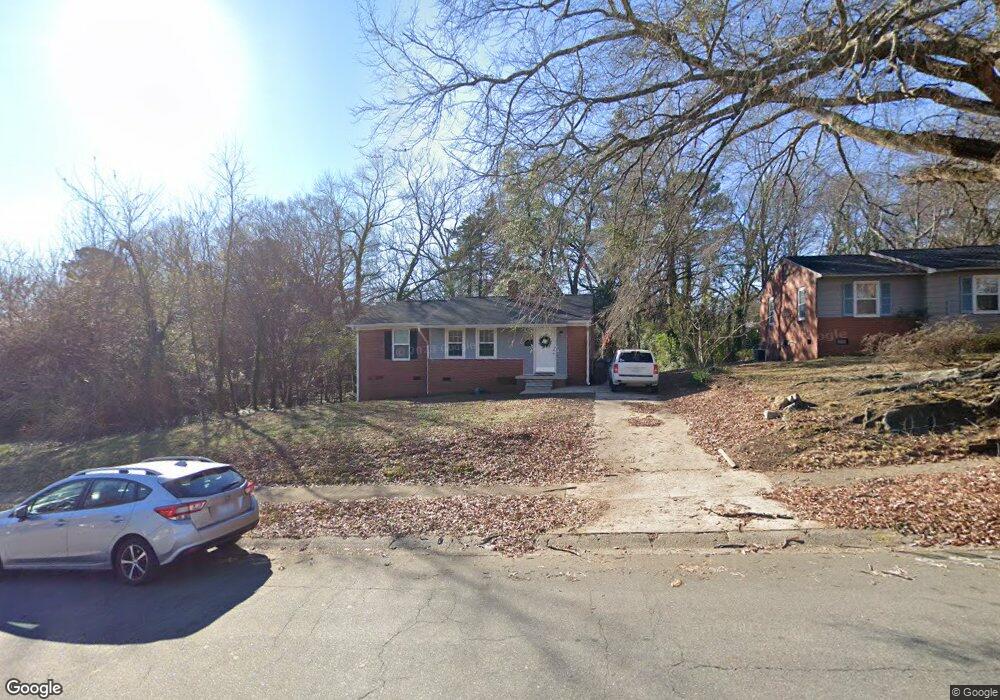
2410 Glascock St Raleigh, NC 27610
King Charles NeighborhoodEstimated Value: $334,000 - $376,000
3
Beds
1
Bath
1,047
Sq Ft
$339/Sq Ft
Est. Value
About This Home
This home is located at 2410 Glascock St, Raleigh, NC 27610 and is currently estimated at $354,663, approximately $338 per square foot. 2410 Glascock St is a home located in Wake County with nearby schools including Powell Elementary, Leroy Martin Magnet, and Enloe High.
Ownership History
Date
Name
Owned For
Owner Type
Purchase Details
Closed on
Jul 31, 2023
Sold by
Suggs Ty Winston and Suggs Denise Kelley
Bought by
G & K Ventures Llc
Current Estimated Value
Purchase Details
Closed on
Feb 25, 2019
Sold by
Harrison Benjamin Ryan and Harrison Danielle S
Bought by
Suggs Ty Winston and Suggs Denise Kelley
Purchase Details
Closed on
May 27, 2016
Sold by
The Secretary Of Hud
Bought by
Harrison Benjamin Ryan and Harrison Danielle S
Purchase Details
Closed on
Aug 24, 2006
Sold by
Moore Robert A
Bought by
Cisneros Macario De Leon and Cisneros Petra
Home Financials for this Owner
Home Financials are based on the most recent Mortgage that was taken out on this home.
Original Mortgage
$77,400
Interest Rate
6.73%
Mortgage Type
Purchase Money Mortgage
Purchase Details
Closed on
Jan 1, 2004
Sold by
Moore & Son Rental Properties Llc
Bought by
Moore Robert A
Purchase Details
Closed on
Jul 30, 2003
Sold by
Moore Alvin G
Bought by
Moore & Son Rental Properties Llc
Purchase Details
Closed on
Nov 5, 2002
Sold by
Hart Ben W
Bought by
Moore Alvin G
Create a Home Valuation Report for This Property
The Home Valuation Report is an in-depth analysis detailing your home's value as well as a comparison with similar homes in the area
Home Values in the Area
Average Home Value in this Area
Purchase History
| Date | Buyer | Sale Price | Title Company |
|---|---|---|---|
| G & K Ventures Llc | -- | None Listed On Document | |
| Suggs Ty Winston | $235,000 | None Available | |
| Harrison Benjamin Ryan | -- | None Available | |
| Cisneros Macario De Leon | $86,000 | None Available | |
| Moore Robert A | -- | -- | |
| Moore & Son Rental Properties Llc | -- | -- | |
| Moore Alvin G | $55,000 | -- |
Source: Public Records
Mortgage History
| Date | Status | Borrower | Loan Amount |
|---|---|---|---|
| Previous Owner | Cisneros Macario De Leon | $77,400 |
Source: Public Records
Tax History
| Year | Tax Paid | Tax Assessment Tax Assessment Total Assessment is a certain percentage of the fair market value that is determined by local assessors to be the total taxable value of land and additions on the property. | Land | Improvement |
|---|---|---|---|---|
| 2025 | $3,037 | $345,976 | $200,000 | $145,976 |
| 2024 | $3,025 | $345,976 | $200,000 | $145,976 |
Source: Public Records
Map
Nearby Homes
- 2408 Glascock St
- 1129 Marlborough Rd
- 808 Culpepper Ln
- 1003 Phoenix Place
- 2802 Milburnie Rd
- 1232 Somerset Rd
- 2528 Remington Rd
- 1110 Brighton Rd
- 2343 Derby Dr
- 709 Brighton Rd
- 2335 Derby Dr
- 2201 Millbank Village Ct Unit 101
- 2205 Millbank Village Ct Unit 102
- 2425 Derby Dr
- 817 N King Charles Rd
- 2309 Bertie Dr
- 1201 Downing Rd
- 1206 Downing Rd
- 1300 Park Glen Dr Unit 102
- 1310 Park Glen Dr Unit 203
- 917 Devonport Dr
- 913 Devonport Dr
- 2404 Glascock St
- 911 Devonport Dr
- 910 Marlborough Rd
- 2413 Glascock St
- 2411 Glascock St
- 912 Marlborough Rd
- 914 Marlborough Rd
- 2417 Glascock St
- 2407 Glascock St
- 907 Devonport Dr
- 908 Marlborough Rd
- 916 Devonport Dr
- 2419 Glascock St
- 2405 Glascock St
- 912 Devonport Dr
- 906 Marlborough Rd
- 905 Devonport Dr
- 2423 Glascock St
Your Personal Tour Guide
Ask me questions while you tour the home.