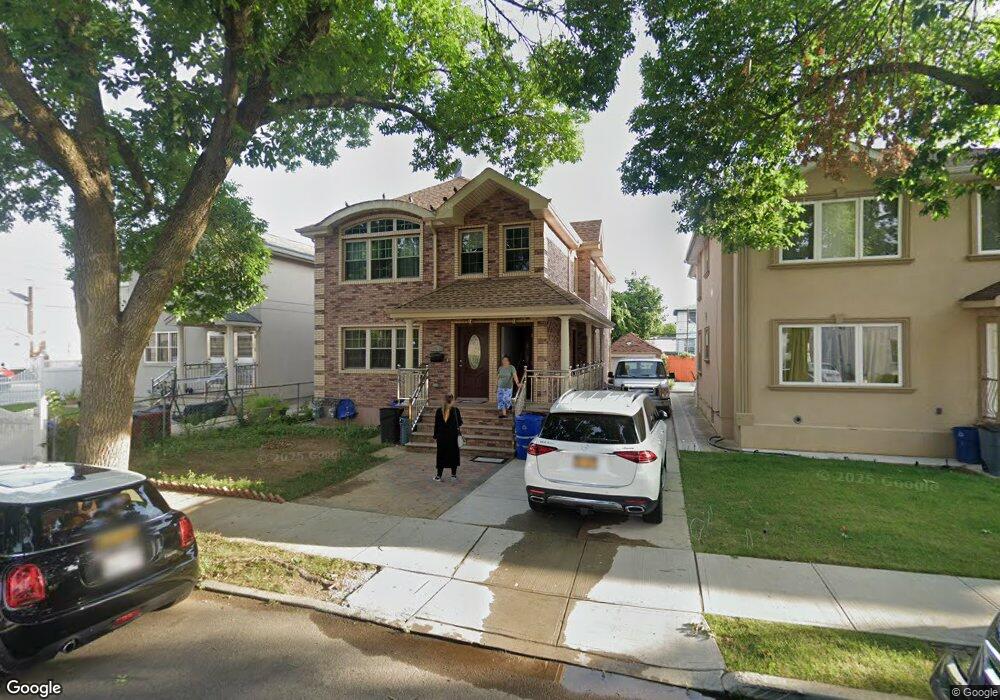
24105 85th Rd Bellerose, NY 11426
Bellerose NeighborhoodEstimated Value: $806,000 - $1,412,322
--
Bed
--
Bath
2,224
Sq Ft
$528/Sq Ft
Est. Value
About This Home
This home is located at 24105 85th Rd, Bellerose, NY 11426 and is currently estimated at $1,174,581, approximately $528 per square foot. 24105 85th Rd is a home located in Queens County with nearby schools including Fremont/Hay Elementary School, P.S. 18 Q The Winchester School, and Shasta Middle School.
Ownership History
Date
Name
Owned For
Owner Type
Purchase Details
Closed on
Dec 20, 2024
Sold by
Ye Jing
Bought by
Fernandez Charito Pasaoa and Fernandez Charlene Kimberly
Current Estimated Value
Home Financials for this Owner
Home Financials are based on the most recent Mortgage that was taken out on this home.
Original Mortgage
$1,100,000
Outstanding Balance
$1,089,407
Interest Rate
6.81%
Mortgage Type
Purchase Money Mortgage
Estimated Equity
$85,174
Purchase Details
Closed on
Jun 27, 2018
Sold by
Iqbal Ahmad
Bought by
Ye Jing
Home Financials for this Owner
Home Financials are based on the most recent Mortgage that was taken out on this home.
Original Mortgage
$580,000
Interest Rate
4.5%
Mortgage Type
New Conventional
Purchase Details
Closed on
Jul 9, 2015
Sold by
Estate Of G Lorraine Oliger and Graffeo Johnalyn J
Bought by
Ahmed Iqbal
Create a Home Valuation Report for This Property
The Home Valuation Report is an in-depth analysis detailing your home's value as well as a comparison with similar homes in the area
Home Values in the Area
Average Home Value in this Area
Purchase History
| Date | Buyer | Sale Price | Title Company |
|---|---|---|---|
| Fernandez Charito Pasaoa | $1,375,000 | -- | |
| Fernandez Charito Pasaoa | $1,375,000 | -- | |
| Ye Jing | $1,135,000 | -- | |
| Ye Jing | $1,135,000 | -- | |
| Ye Jing | $1,135,000 | -- | |
| Ahmed Iqbal | $430,000 | -- | |
| Ahmed Iqbal | $430,000 | -- | |
| Ahmed Iqbal | $430,000 | -- |
Source: Public Records
Mortgage History
| Date | Status | Borrower | Loan Amount |
|---|---|---|---|
| Open | Fernandez Charito Pasaoa | $1,100,000 | |
| Closed | Fernandez Charito Pasaoa | $1,100,000 | |
| Previous Owner | Ye Jing | $580,000 |
Source: Public Records
Tax History Compared to Growth
Tax History
| Year | Tax Paid | Tax Assessment Tax Assessment Total Assessment is a certain percentage of the fair market value that is determined by local assessors to be the total taxable value of land and additions on the property. | Land | Improvement |
|---|---|---|---|---|
| 2025 | $8,552 | $45,134 | $11,848 | $33,286 |
| 2024 | $8,552 | $42,579 | $11,104 | $31,475 |
| 2023 | $8,408 | $41,863 | $10,485 | $31,378 |
| 2022 | $8,071 | $58,140 | $16,680 | $41,460 |
| 2021 | $8,509 | $48,180 | $16,680 | $31,500 |
| 2020 | $8,370 | $46,995 | $16,680 | $30,315 |
| 2019 | $4,539 | $27,480 | $12,600 | $14,880 |
| 2018 | $4,301 | $21,099 | $8,266 | $12,833 |
| 2017 | $4,058 | $19,905 | $8,800 | $11,105 |
| 2016 | $3,979 | $19,905 | $8,800 | $11,105 |
| 2015 | $694 | $19,164 | $8,653 | $10,511 |
| 2014 | $694 | $18,080 | $9,797 | $8,283 |
Source: Public Records
Map
Nearby Homes
- 23913 86th Ave
- 24125 85th Ave
- 241-10 86th Ave
- 24134 87th Ave
- 83-27 Commonwealth Blvd
- 24612 86th Rd
- 24607 87th Ave
- 8344 247th St
- 84-17 247th St
- 242-27 88th Dr
- 246-31 87th Ave
- 83-17 247th St
- 83-46 248th St
- 246-59 86th Rd
- 8860 240th St
- 87-01 Commonwealth Blvd
- 81-27 242nd St
- 246-62 87th Ave
- 88-19 247th St
- 82-08 247th St
- 24109 85th Rd Unit 2
- 24109 85th Rd
- 24109 85th Rd
- 24101 85th Rd
- 241-9 85th Rd
- 241-05 85th Rd Unit 2nd Fl
- 241-05 85th Rd Unit 1st Fl
- 24111 85th Rd Unit 2nd FL
- 24111 85th Rd
- 24111 85th Rd
- 24106 85th Ave
- 24102 85th Ave
- 24110 85th Ave
- 24115 85th Rd
- 24114 85th Ave
- 24106 85th Rd
- 24118 85th Ave
- 24110 85th Rd
- 24102 85th Rd
- 24119 85th Rd