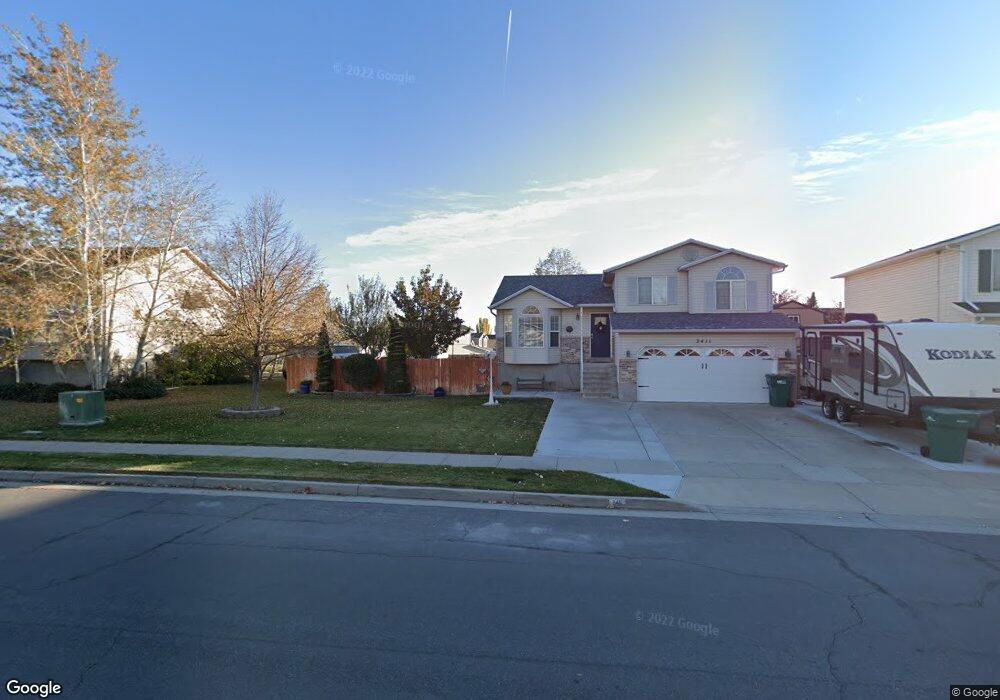
2411 W 1275 N Layton, UT 84041
Estimated Value: $480,300 - $497,000
5
Beds
2
Baths
1,785
Sq Ft
$274/Sq Ft
Est. Value
About This Home
This home is located at 2411 W 1275 N, Layton, UT 84041 and is currently estimated at $489,825, approximately $274 per square foot. 2411 W 1275 N is a home located in Davis County with nearby schools including Ellison Park School, Shoreline Junior High School, and Layton High School.
Ownership History
Date
Name
Owned For
Owner Type
Purchase Details
Closed on
Sep 6, 2019
Sold by
Judy Georgia K
Bought by
Judy Georgia K and Pickle Robert T
Current Estimated Value
Home Financials for this Owner
Home Financials are based on the most recent Mortgage that was taken out on this home.
Original Mortgage
$299,999
Outstanding Balance
$262,744
Interest Rate
3.7%
Mortgage Type
VA
Estimated Equity
$227,081
Purchase Details
Closed on
Feb 13, 2004
Sold by
Richards David P and Richards Jana I
Bought by
Judy Georgia K
Home Financials for this Owner
Home Financials are based on the most recent Mortgage that was taken out on this home.
Original Mortgage
$148,190
Interest Rate
5.85%
Mortgage Type
VA
Purchase Details
Closed on
Jul 13, 1999
Sold by
Woodside Homes Corp
Bought by
Richards David P and Richards Jana I
Home Financials for this Owner
Home Financials are based on the most recent Mortgage that was taken out on this home.
Original Mortgage
$126,203
Interest Rate
7.4%
Mortgage Type
FHA
Create a Home Valuation Report for This Property
The Home Valuation Report is an in-depth analysis detailing your home's value as well as a comparison with similar homes in the area
Home Values in the Area
Average Home Value in this Area
Purchase History
| Date | Buyer | Sale Price | Title Company |
|---|---|---|---|
| Judy Georgia K | -- | Cottonwood Title | |
| Judy Georgia K | -- | Equity Title Agency | |
| Richards David P | -- | First American Title Co |
Source: Public Records
Mortgage History
| Date | Status | Borrower | Loan Amount |
|---|---|---|---|
| Open | Judy Georgia K | $299,999 | |
| Closed | Judy Georgia K | $148,190 | |
| Previous Owner | Richards David P | $126,203 |
Source: Public Records
Tax History
| Year | Tax Paid | Tax Assessment Tax Assessment Total Assessment is a certain percentage of the fair market value that is determined by local assessors to be the total taxable value of land and additions on the property. | Land | Improvement |
|---|---|---|---|---|
| 2025 | $2,337 | $245,300 | $108,938 | $136,362 |
| 2024 | $2,257 | $238,700 | $120,912 | $117,788 |
| 2023 | $2,162 | $403,000 | $118,831 | $284,169 |
| 2022 | $2,364 | $239,250 | $74,862 | $164,388 |
| 2021 | $2,080 | $314,000 | $112,323 | $201,677 |
| 2020 | $1,871 | $271,000 | $94,322 | $176,678 |
| 2019 | $1,819 | $258,000 | $97,366 | $160,634 |
| 2018 | $1,749 | $249,000 | $85,331 | $163,669 |
| 2016 | $1,513 | $111,101 | $33,226 | $77,875 |
| 2015 | $1,519 | $105,931 | $33,226 | $72,705 |
| 2014 | $1,430 | $101,928 | $33,226 | $68,702 |
| 2013 | -- | $101,001 | $28,952 | $72,049 |
Source: Public Records
Map
Nearby Homes
- 1186 N 2425 W
- 1141 N 2275 W
- 2144 W 1275 N
- 1876 W 1575 N Unit 237
- 841 N 2175 W
- 1491 N 1875 W
- 1452 N 1875 W Unit 146
- 1487 N 1875 W
- 1483 N 1875 W
- 1479 N 1875 W
- 1479 N 1875 W Unit 161
- 867 N 2125 W
- 1558 N 1875 W
- 1558 N 1875 W Unit 245
- 1570 N 1875 W Unit 242
- 1570 N 1875 W
- 1471 N 1875 W
- 1471 N 1875 W Unit 163
- 1451 N 1875 W Unit 168
- 816 N 2700 W
Your Personal Tour Guide
Ask me questions while you tour the home.