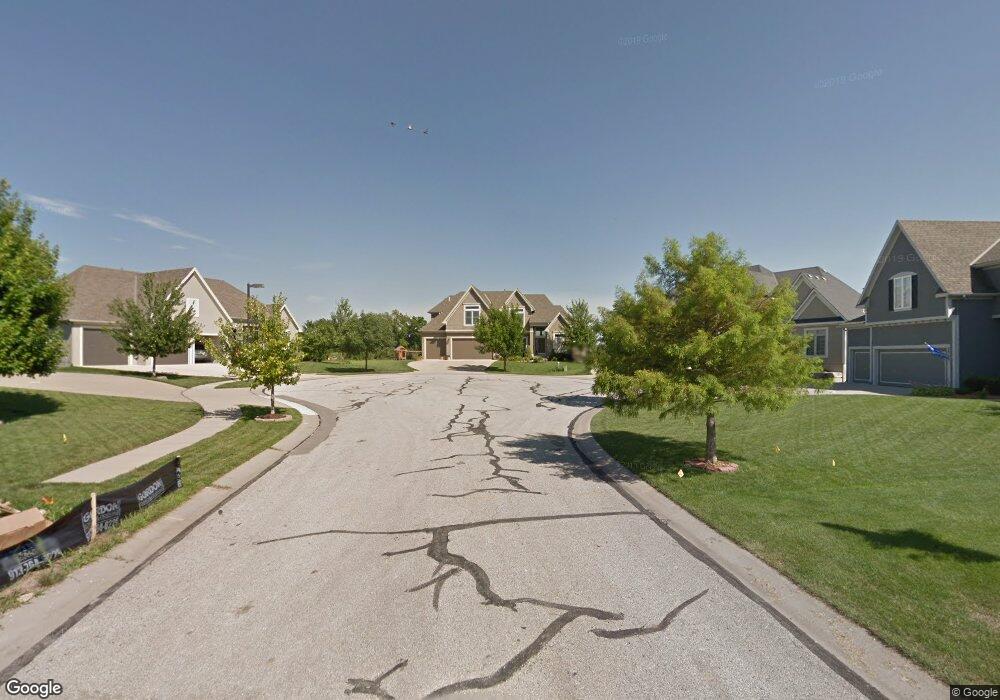
24119 W 95th Terrace Lenexa, KS 66227
Estimated Value: $628,000 - $812,000
5
Beds
5
Baths
3,169
Sq Ft
$225/Sq Ft
Est. Value
About This Home
This home is located at 24119 W 95th Terrace, Lenexa, KS 66227 and is currently estimated at $713,871, approximately $225 per square foot. 24119 W 95th Terrace is a home located in Johnson County with nearby schools including Canyon Creek Elementary School, Prairie Trail Middle School, and Olathe Northwest High School.
Ownership History
Date
Name
Owned For
Owner Type
Purchase Details
Closed on
Aug 8, 2011
Sold by
Zitnik Frank J and Zitnik Julie A
Bought by
Booth Michael A and Booth Tamie M
Current Estimated Value
Purchase Details
Closed on
Jun 7, 2007
Sold by
Rounbehler Construction Inc
Bought by
Zitnik Frank J and Zitnik Julie A
Home Financials for this Owner
Home Financials are based on the most recent Mortgage that was taken out on this home.
Original Mortgage
$250,000
Interest Rate
6.41%
Mortgage Type
New Conventional
Purchase Details
Closed on
Aug 17, 2005
Sold by
Patrician Village Llc
Bought by
Rounbehler Construction Inc
Create a Home Valuation Report for This Property
The Home Valuation Report is an in-depth analysis detailing your home's value as well as a comparison with similar homes in the area
Home Values in the Area
Average Home Value in this Area
Purchase History
| Date | Buyer | Sale Price | Title Company |
|---|---|---|---|
| Booth Michael A | -- | Alpha Title Llc | |
| Zitnik Frank J | -- | First American Title Insuran | |
| Rounbehler Construction Inc | -- | First Ameican Title Ins |
Source: Public Records
Mortgage History
| Date | Status | Borrower | Loan Amount |
|---|---|---|---|
| Previous Owner | Zitnik Frank J | $250,000 |
Source: Public Records
Tax History Compared to Growth
Tax History
| Year | Tax Paid | Tax Assessment Tax Assessment Total Assessment is a certain percentage of the fair market value that is determined by local assessors to be the total taxable value of land and additions on the property. | Land | Improvement |
|---|---|---|---|---|
| 2024 | $7,949 | $64,630 | $15,665 | $48,965 |
| 2023 | $7,729 | $61,743 | $13,049 | $48,694 |
| 2022 | $7,696 | $56,937 | $11,868 | $45,069 |
| 2021 | $7,439 | $52,302 | $11,868 | $40,434 |
| 2020 | $7,047 | $48,898 | $11,868 | $37,030 |
| 2019 | $7,437 | $51,405 | $10,792 | $40,613 |
| 2018 | $7,161 | $48,841 | $10,785 | $38,056 |
| 2017 | $7,140 | $47,644 | $9,799 | $37,845 |
| 2016 | $6,726 | $45,632 | $8,910 | $36,722 |
| 2015 | $6,673 | $45,126 | $8,910 | $36,216 |
| 2013 | -- | $42,469 | $8,910 | $33,559 |
Source: Public Records
Map
Nearby Homes
- 24112 W 95th Terrace
- 24111 W 95th St
- 24109 W 95th St
- 24110 W 95th St
- 22502 W 93rd Terrace
- 22504 W 93rd Terrace
- 24948 W 98th Place
- 9346 Gander St
- 24960 W 98th Place
- 24928 W 98th Place
- 9742 Shady Bend Cir
- 23509 W 93rd St
- 24964 W 98th Place
- 24949 W 98th Place
- 24916 W 98th Place
- 24968 W 98th Place
- 24912 W 98th Place
- 24921 W 98th Place
- 24908 W 98th Place
- 24917 W 98th Place
- 24123 W 95th Terrace
- 24120 W 95th Terrace
- 24042 W 97th Terrace
- 24124 W 95th Terrace
- 24064 W 97th Terrace
- 9643 Mccormack Dr
- 9631 Mccormack Dr
- 9655 Mccormack Dr
- 24131 W 95th Terrace
- 9625 Mccormack Dr
- 24020 W 97th Terrace
- 24128 W 95th Terrace
- 9667 Mccormack Dr
- 24086 W 97th Terrace
- 24132 W 95th Terrace
- 24135 W 95th Terrace
- Lot 67 Carbondale St
- Lot 68 Carbondale St
- 9679 Mccormack Dr
- 23998 W 97th Terrace