2413 Pendower Ln Unit S5 41 Keswick, VA 22947
Rivanna NeighborhoodEstimated Value: $1,129,000 - $1,337,357
5
Beds
6
Baths
3,565
Sq Ft
$351/Sq Ft
Est. Value
About This Home
This home is located at 2413 Pendower Ln Unit S5 41, Keswick, VA 22947 and is currently estimated at $1,250,589, approximately $350 per square foot. 2413 Pendower Ln Unit S5 41 is a home located in Albemarle County with nearby schools including Stone Robinson Elementary School, Jackson P. Burley Middle School, and Monticello High School.
Ownership History
Date
Name
Owned For
Owner Type
Purchase Details
Closed on
Nov 15, 2024
Sold by
Shakhatreh Mohammad Hussein and Athamneh Liqa Nasser
Bought by
Gunn Rita N and Gunn David A
Current Estimated Value
Home Financials for this Owner
Home Financials are based on the most recent Mortgage that was taken out on this home.
Original Mortgage
$593,750
Outstanding Balance
$587,473
Interest Rate
6.32%
Mortgage Type
New Conventional
Estimated Equity
$663,117
Purchase Details
Closed on
Apr 1, 2021
Sold by
Ragland Chad A and Ragland Melissa J
Bought by
Shakhatreh Mohammad Hussein and Athamneh Liqa Nasser
Purchase Details
Closed on
May 2, 2013
Sold by
Piedmont Neighborhoods Lp
Bought by
Ragland Chad A and Ragland Melissa J
Home Financials for this Owner
Home Financials are based on the most recent Mortgage that was taken out on this home.
Original Mortgage
$589,600
Interest Rate
3.6%
Mortgage Type
New Conventional
Create a Home Valuation Report for This Property
The Home Valuation Report is an in-depth analysis detailing your home's value as well as a comparison with similar homes in the area
Home Values in the Area
Average Home Value in this Area
Purchase History
| Date | Buyer | Sale Price | Title Company |
|---|---|---|---|
| Gunn Rita N | $1,187,500 | Vs Title | |
| Gunn Rita N | $1,187,500 | Vs Title | |
| Shakhatreh Mohammad Hussein | $835,000 | Fidelity National Ttl Ins Co | |
| Ragland Chad A | $737,087 | Stewart Title Guaranty Co |
Source: Public Records
Mortgage History
| Date | Status | Borrower | Loan Amount |
|---|---|---|---|
| Open | Gunn Rita N | $593,750 | |
| Closed | Gunn Rita N | $593,750 | |
| Previous Owner | Ragland Chad A | $589,600 |
Source: Public Records
Tax History Compared to Growth
Tax History
| Year | Tax Paid | Tax Assessment Tax Assessment Total Assessment is a certain percentage of the fair market value that is determined by local assessors to be the total taxable value of land and additions on the property. | Land | Improvement |
|---|---|---|---|---|
| 2025 | $10,640 | $1,190,100 | $206,400 | $983,700 |
| 2024 | $8,947 | $1,047,700 | $206,400 | $841,300 |
| 2023 | $8,163 | $955,800 | $206,400 | $749,400 |
| 2022 | $7,189 | $841,800 | $158,400 | $683,400 |
| 2021 | $6,566 | $768,900 | $150,500 | $618,400 |
| 2020 | $6,554 | $767,400 | $150,500 | $616,900 |
| 2019 | $6,636 | $777,100 | $150,500 | $626,600 |
| 2018 | $6,453 | $767,300 | $145,900 | $621,400 |
| 2017 | $6,469 | $771,000 | $145,900 | $625,100 |
| 2016 | $6,313 | $752,400 | $145,600 | $606,800 |
| 2015 | $3,071 | $750,000 | $145,600 | $604,400 |
| 2014 | -- | $706,200 | $132,000 | $574,200 |
Source: Public Records
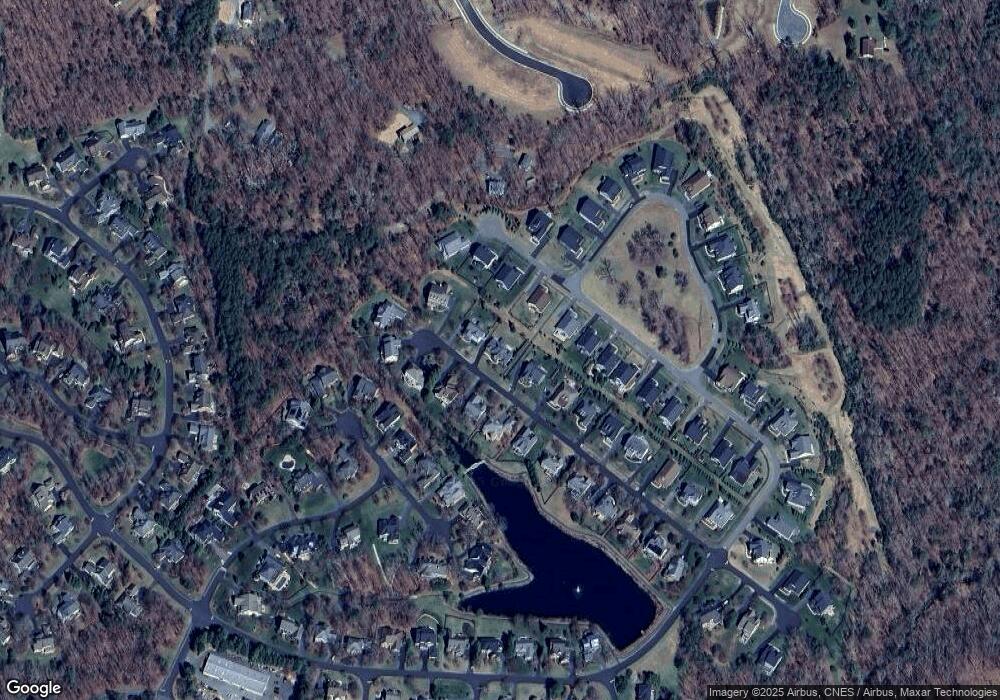
Map
Nearby Homes
- 3605 Turnbridge Ln
- 3422 Darby Rd
- 2481 Pendower Ln
- 5127 Lazy Branch Ln
- 1493 Bremerton Ln
- Caicos Plan at Rivanna Village - Rivanna Village Villas
- 5129 Lazy Branch Ln
- 5126 Lazy Branch Ln
- 5130 Lazy Branch Ln
- 5137 Lazy Branch Ln
- 5160 Lazy Branch Ln
- 5146 Lazy Branch Ln
- 401A Lazy Branch Ln
- 1526 Bremerton Ln
- 5163 Lazy Branch Ln
- 5148 Lazy Branch Ln
- 2413 Pendower Ln
- 2407 Pendower Ln Unit S5 42
- 2407 Pendower Ln
- 2419 Pendower Ln
- 2414 Pendower Ln Unit S3-13
- 2414 Pendower Ln
- 2408 Pendower Ln
- 2471 Ferndown Ln
- 2465 Ferndown Ln
- 2420 Pendower Ln Unit S3 12
- 2420 Pendower Ln
- 2425 Pendower Ln Unit S5 39
- 2425 Pendower Ln
- 2403 Pendower Ln Unit S5 43
- 2403 Pendower Ln
- 2402 Pendower Ln Unit S3 15
- 24 Ferndown Ln
- 2459 Ferndown Ln
- 2483 Ferndown Ln
- 2431 Pendower Ln Unit S5 38