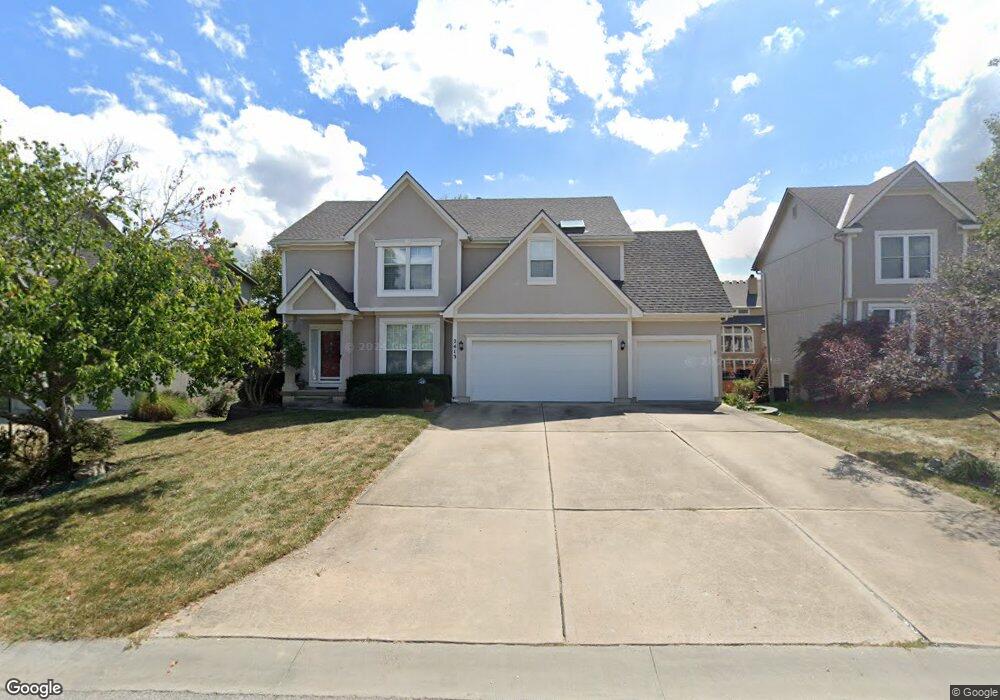
2413 SW 11th St Lees Summit, MO 64081
Estimated Value: $463,334 - $547,000
3
Beds
4
Baths
2,368
Sq Ft
$205/Sq Ft
Est. Value
About This Home
This home is located at 2413 SW 11th St, Lees Summit, MO 64081 and is currently estimated at $484,834, approximately $204 per square foot. 2413 SW 11th St is a home located in Jackson County with nearby schools including Longview Farm Elementary School, Summit Lakes Middle School, and Lee's Summit West High School.
Ownership History
Date
Name
Owned For
Owner Type
Purchase Details
Closed on
Aug 21, 2014
Sold by
Barnes Royce O and Barnes Phyllis
Bought by
Barnes Michael O
Current Estimated Value
Home Financials for this Owner
Home Financials are based on the most recent Mortgage that was taken out on this home.
Original Mortgage
$180,000
Outstanding Balance
$137,454
Interest Rate
4.15%
Mortgage Type
New Conventional
Estimated Equity
$347,380
Purchase Details
Closed on
Jan 20, 2005
Sold by
Bugler Barnes Royce Owen and Bugler Barnes Phyllis
Bought by
The Barnes Family Trust
Purchase Details
Closed on
Jul 30, 1998
Sold by
Perry Building Co
Bought by
Bugler Barnes Royce and Bugler Barnes Phyllis
Home Financials for this Owner
Home Financials are based on the most recent Mortgage that was taken out on this home.
Original Mortgage
$125,000
Interest Rate
6.94%
Mortgage Type
Purchase Money Mortgage
Purchase Details
Closed on
Jun 4, 1996
Sold by
Southland Developers Llc
Bought by
Perry Building Co
Create a Home Valuation Report for This Property
The Home Valuation Report is an in-depth analysis detailing your home's value as well as a comparison with similar homes in the area
Home Values in the Area
Average Home Value in this Area
Purchase History
| Date | Buyer | Sale Price | Title Company |
|---|---|---|---|
| Barnes Michael O | -- | Kansas City Title Inc | |
| The Barnes Family Trust | -- | -- | |
| Bugler Barnes Royce | -- | Old Republic Title | |
| Perry Building Co | -- | Security Land Title Company |
Source: Public Records
Mortgage History
| Date | Status | Borrower | Loan Amount |
|---|---|---|---|
| Open | Barnes Michael O | $180,000 | |
| Closed | Bugler Barnes Royce | $125,000 |
Source: Public Records
Tax History Compared to Growth
Tax History
| Year | Tax Paid | Tax Assessment Tax Assessment Total Assessment is a certain percentage of the fair market value that is determined by local assessors to be the total taxable value of land and additions on the property. | Land | Improvement |
|---|---|---|---|---|
| 2025 | $5,388 | $69,853 | $11,981 | $57,872 |
| 2024 | $5,349 | $74,619 | $8,596 | $66,023 |
| 2023 | $5,349 | $74,619 | $11,683 | $62,936 |
| 2022 | $4,264 | $52,820 | $6,451 | $46,369 |
| 2021 | $4,352 | $52,820 | $6,451 | $46,369 |
| 2020 | $4,394 | $52,803 | $6,451 | $46,352 |
| 2019 | $4,274 | $52,803 | $6,451 | $46,352 |
| 2018 | $4,008 | $45,955 | $5,614 | $40,341 |
| 2017 | $4,008 | $45,955 | $5,614 | $40,341 |
| 2016 | $3,805 | $43,187 | $5,605 | $37,582 |
| 2014 | $3,770 | $41,944 | $5,606 | $36,338 |
Source: Public Records
Map
Nearby Homes
- 1217 SW Sunflower Dr
- 2320 SW 10th St
- 916 SW Sara Cir
- 812 SW Cutter Ct
- 1051 SW Fiord Dr
- 1106 SW Fiord Dr
- 1039 SW Fiord Dr
- 2644 SW 9th Terrace
- 1035 SW Fiord Dr
- 2755 SW 11th Terrace
- 2766 SW 12 St
- 601 SW Forestpark Ln
- 1052 SW Argyl St
- 2767 SW 12th Terrace
- 1216 SE Ranchland St
- 2771 SW 12th Terrace
- Winfield Plan at Highland Meadows
- Wildflower in Highland Meadows Plan at Highland Meadows
- Sunflower Plan at Highland Meadows
- Sheffield Plan at Highland Meadows
- 2409 SW 11th St
- 2417 SW 11th St
- 2421 SW 11th St
- 2420 SW 11th St
- 2405 SW 11th St
- 2416 SW 11th St
- 2424 SW 11th St
- 2410 SW 11th Terrace
- 2406 SW 11th Terrace
- 2414 SW 11th Terrace
- 2412 SW 11th St
- 2428 SW 11th St
- 2425 SW 11th St
- 2402 SW 11th Terrace
- 2418 SW 11th Terrace
- 2401 SW 11th St
- 2408 SW 11th St
- 2422 SW 11th Terrace
- 1005 SW 11th Cir
- 2404 SW 11th St