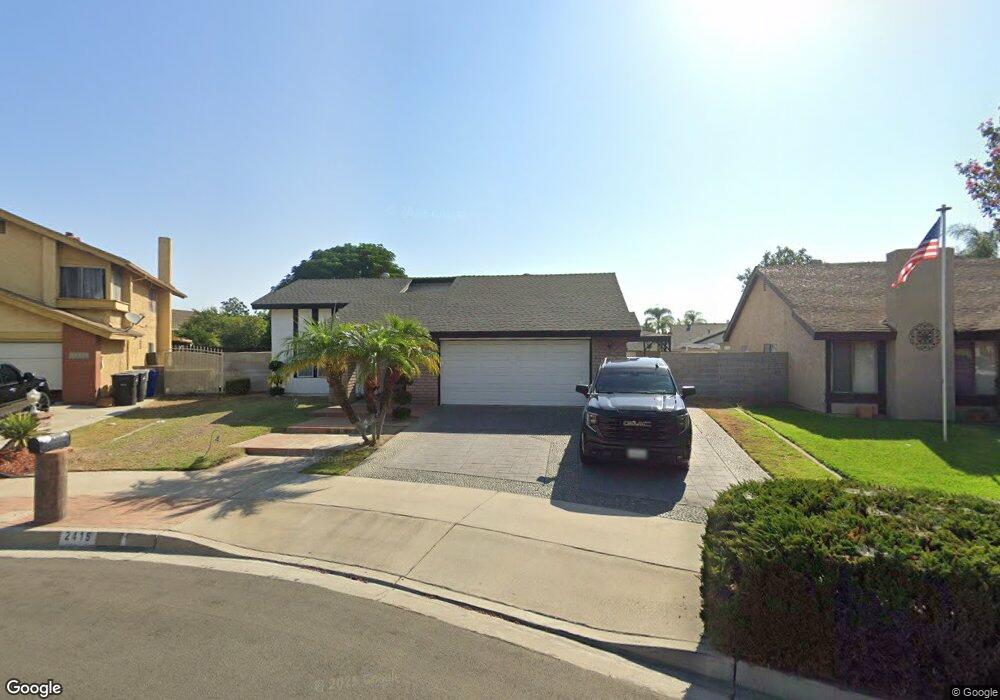
2415 S Phoenix Place Ontario, CA 91761
Downtown Ontario NeighborhoodEstimated Value: $660,255 - $802,000
3
Beds
2
Baths
1,432
Sq Ft
$504/Sq Ft
Est. Value
About This Home
This home is located at 2415 S Phoenix Place, Ontario, CA 91761 and is currently estimated at $721,564, approximately $503 per square foot. 2415 S Phoenix Place is a home located in San Bernardino County with nearby schools including Bon View Elementary, De Anza Middle, and Ontario High School.
Ownership History
Date
Name
Owned For
Owner Type
Purchase Details
Closed on
Apr 13, 2021
Sold by
Correa Ruben and Correa Ruben
Bought by
Correa Ruben
Current Estimated Value
Purchase Details
Closed on
Aug 25, 2017
Sold by
Correa Ruben
Bought by
Correa Ruben
Home Financials for this Owner
Home Financials are based on the most recent Mortgage that was taken out on this home.
Original Mortgage
$160,000
Outstanding Balance
$133,826
Interest Rate
3.96%
Mortgage Type
New Conventional
Estimated Equity
$587,738
Purchase Details
Closed on
Apr 15, 2003
Sold by
Correa Ruben
Bought by
Correa Ruben
Purchase Details
Closed on
Sep 24, 1997
Sold by
State Street Bank & Trust Co
Bought by
Correa Ruben and Correa Eleanor A
Home Financials for this Owner
Home Financials are based on the most recent Mortgage that was taken out on this home.
Original Mortgage
$85,600
Interest Rate
7.36%
Purchase Details
Closed on
Jul 1, 1997
Sold by
Jimenez Meraz Heber
Bought by
State Street Bank & Trust Company
Create a Home Valuation Report for This Property
The Home Valuation Report is an in-depth analysis detailing your home's value as well as a comparison with similar homes in the area
Home Values in the Area
Average Home Value in this Area
Purchase History
| Date | Buyer | Sale Price | Title Company |
|---|---|---|---|
| Correa Ruben | -- | Nextitle | |
| Correa Ruben | -- | Lawyers Title | |
| Correa Ruben | -- | Lawyers Title | |
| Correa Ruben | -- | -- | |
| Correa Ruben | $107,000 | Old Republic Title Company | |
| State Street Bank & Trust Company | $108,271 | First American Title Ins Co |
Source: Public Records
Mortgage History
| Date | Status | Borrower | Loan Amount |
|---|---|---|---|
| Open | Correa Ruben | $160,000 | |
| Closed | Correa Ruben | $85,600 |
Source: Public Records
Tax History Compared to Growth
Tax History
| Year | Tax Paid | Tax Assessment Tax Assessment Total Assessment is a certain percentage of the fair market value that is determined by local assessors to be the total taxable value of land and additions on the property. | Land | Improvement |
|---|---|---|---|---|
| 2025 | $2,292 | $207,570 | $63,868 | $143,702 |
| 2024 | $2,292 | $203,500 | $62,616 | $140,884 |
| 2023 | $2,229 | $199,510 | $61,388 | $138,122 |
| 2022 | $2,201 | $195,598 | $60,184 | $135,414 |
| 2021 | $2,187 | $191,763 | $59,004 | $132,759 |
| 2020 | $2,150 | $189,797 | $58,399 | $131,398 |
| 2019 | $2,132 | $186,076 | $57,254 | $128,822 |
| 2018 | $2,104 | $182,427 | $56,131 | $126,296 |
| 2017 | $2,030 | $178,850 | $55,030 | $123,820 |
| 2016 | $1,952 | $175,343 | $53,951 | $121,392 |
| 2015 | $1,939 | $172,710 | $53,141 | $119,569 |
| 2014 | $1,882 | $169,327 | $52,100 | $117,227 |
Source: Public Records
Map
Nearby Homes
- 2408 S Taylor Place
- 513 E Fairfield Ct
- 4235 S Gasly Paseo
- 0 Vineyard Unit CV25067044
- 4245 S Grasly Paseo
- 4233 S Grasly Paseo
- 0 Phillips Unit CV23180894
- 2300 S Sultana Ave Unit 298
- 2119 S Phoenix Place
- 2437 S Garfield Place
- 2148 S Sultana Ave
- 310 E Philadelphia St Unit 35
- 310 E Philadelphia St
- 1020 E Tam o Shanter Ct
- 2030 S Bon View Ave Unit G
- 2001 S Campus Ave Unit 7F
- 840 E Cedar St
- 2453 S Marigold Place
- 2919 S Caldwell Ave
- 2343 S Via Veranda Unit 10
- 2421 S Phoenix Place
- 2409 S Phoenix Place
- 2410 Caldwell Place
- 2420 Caldwell Place
- 2427 S Phoenix Place
- 2402 Caldwell Place
- 2403 S Phoenix Place
- 2426 Caldwell Place
- 2433 S Phoenix Place
- 2402 S Phoenix Place
- 2420 S Phoenix Place
- 2410 S Phoenix Place
- 2432 Caldwell Place
- 2403 Caldwell Place
- 2426 S Phoenix Place
- 2439 S Phoenix Place
- 2438 Caldwell Place
- 2432 S Phoenix Place
- 2421 Caldwell Place
- 2415 Caldwell Place