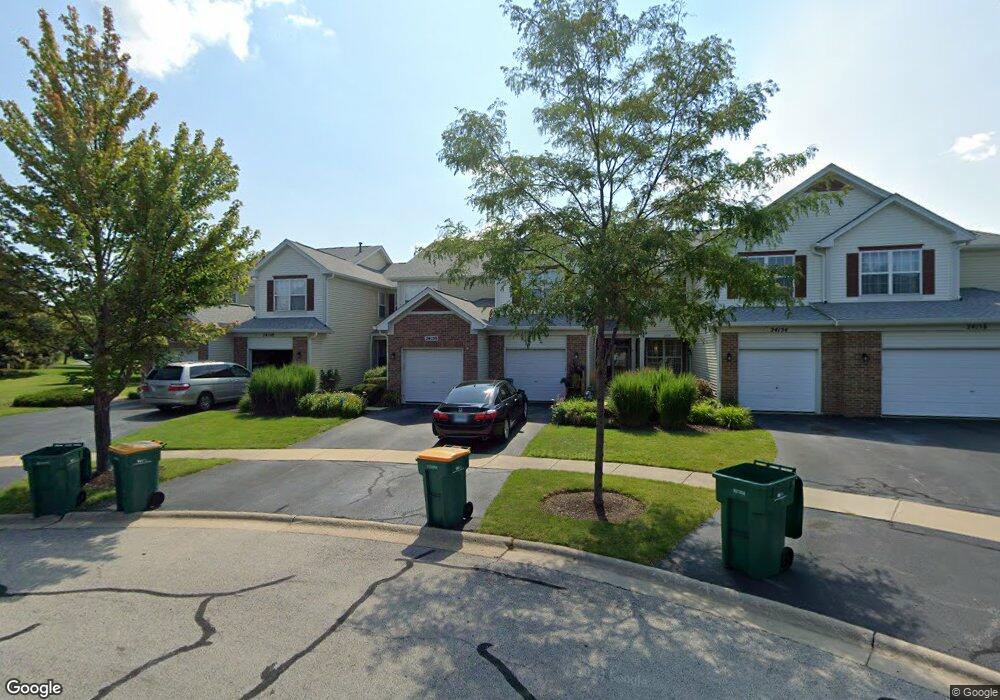
24156 Pear Tree Ct Unit 171506 Plainfield, IL 60585
Estimated Value: $288,000 - $305,578
--
Bed
2
Baths
1,817
Sq Ft
$164/Sq Ft
Est. Value
About This Home
This home is located at 24156 Pear Tree Ct Unit 171506, Plainfield, IL 60585 and is currently estimated at $297,645, approximately $163 per square foot. 24156 Pear Tree Ct Unit 171506 is a home located in Will County with nearby schools including Eagle Pointe Elementary School, Heritage Grove Middle School, and Plainfield North High School.
Ownership History
Date
Name
Owned For
Owner Type
Purchase Details
Closed on
Sep 20, 2007
Sold by
Kirberg Kevin G and Kirberg Jennifer A
Bought by
Kirberg Kevin G and Kirberg Jennifer A
Current Estimated Value
Home Financials for this Owner
Home Financials are based on the most recent Mortgage that was taken out on this home.
Original Mortgage
$152,914
Outstanding Balance
$96,467
Interest Rate
6.5%
Mortgage Type
New Conventional
Estimated Equity
$201,178
Purchase Details
Closed on
Oct 30, 1998
Sold by
St Paul Trust Company
Bought by
Kirberg Kevin G and Kirberg Jennifer A
Home Financials for this Owner
Home Financials are based on the most recent Mortgage that was taken out on this home.
Original Mortgage
$151,100
Interest Rate
6.68%
Mortgage Type
FHA
Create a Home Valuation Report for This Property
The Home Valuation Report is an in-depth analysis detailing your home's value as well as a comparison with similar homes in the area
Home Values in the Area
Average Home Value in this Area
Purchase History
| Date | Buyer | Sale Price | Title Company |
|---|---|---|---|
| Kirberg Kevin G | -- | None Available | |
| Kirberg Kevin G | $158,000 | Chicago Title Insurance Co |
Source: Public Records
Mortgage History
| Date | Status | Borrower | Loan Amount |
|---|---|---|---|
| Open | Kirberg Kevin G | $152,914 | |
| Closed | Kirberg Kevin G | $151,100 |
Source: Public Records
Tax History Compared to Growth
Tax History
| Year | Tax Paid | Tax Assessment Tax Assessment Total Assessment is a certain percentage of the fair market value that is determined by local assessors to be the total taxable value of land and additions on the property. | Land | Improvement |
|---|---|---|---|---|
| 2024 | $6,172 | $92,809 | $17,792 | $75,017 |
| 2023 | $6,172 | $81,986 | $15,717 | $66,269 |
| 2022 | $5,512 | $74,783 | $14,868 | $59,915 |
| 2021 | $5,299 | $71,222 | $14,160 | $57,062 |
| 2020 | $5,292 | $70,094 | $13,936 | $56,158 |
| 2019 | $5,206 | $68,118 | $13,543 | $54,575 |
| 2018 | $4,713 | $61,110 | $13,246 | $47,864 |
| 2017 | $4,682 | $59,532 | $12,904 | $46,628 |
| 2016 | $4,687 | $58,250 | $12,626 | $45,624 |
| 2015 | $4,935 | $56,009 | $12,140 | $43,869 |
| 2014 | $4,935 | $59,006 | $12,140 | $46,866 |
| 2013 | $4,935 | $59,006 | $12,140 | $46,866 |
Source: Public Records
Map
Nearby Homes
- 24115 Pear Tree Cir Unit 170807
- 12154 Pear Tree Way
- 12225 Shagbark Dr
- 24135 Walnut Cir Unit 182504
- 24340 Hemlock Dr
- 24333 Leski Ln
- 2711 Lawlor Ln
- 2739 Lawlor Ln
- 2668 Lawlor Ln
- 11661 S Derby Ln Unit 2
- 5943 Polo St
- 5907 Polo St
- 5919 Polo St
- 5911 Polo St
- 11723 Heritage Meadows Dr
- 2547 Tailshot Rd
- 2611 Lawlor Ln
- 2607 Lawlor Ln
- 2547 Mallet Ct
- 2543 Mallet Ct
- 24148 Pear Tree Ct Unit 171502
- 24150 Pear Tree Ct Unit 171503
- 24152 Pear Tree Ct Unit 171504
- 24146 Pear Tree Ct
- 24150 Pear Tree Ct Unit 24150
- 24088 Pear Tree Cir Unit 171904
- 24084 Pear Tree Cir Unit 171902
- 24092 Pear Tree Cir Unit 171906
- 24086 Pear Tree Cir Unit 171903
- 24082 Pear Tree Cir Unit 171901
- 24090 Pear Tree Cir Unit 171905
- 24086 Pear Tree Cir Unit 1
- 24086 Pear Tree Cir Unit 6
- 24060 Pear Tree Cir Unit 172006
- 24054 Pear Tree Cir Unit 172003
- 24056 Pear Tree Cir Unit 172004
- 24052 Pear Tree Cir Unit 172002
- 24050 W Pear Tree Cir Unit 172001
- 24032 Pear Tree Cir Unit 172108
- 24168 Pear Tree Ct Unit 171404