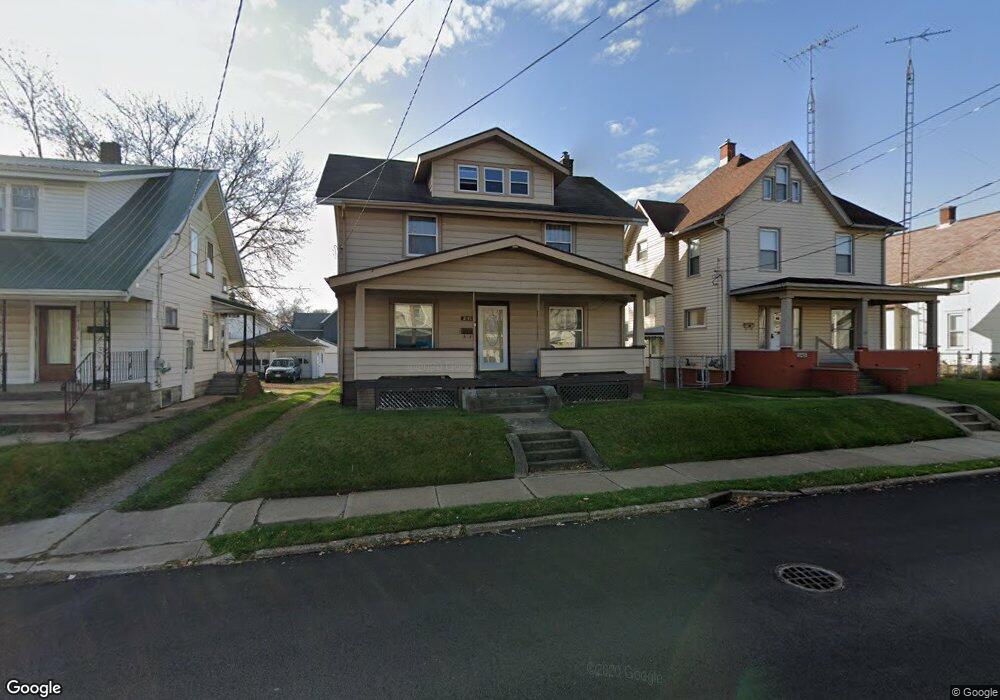
2416 11th St SW Canton, OH 44710
Southwest Canton NeighborhoodEstimated Value: $88,000 - $108,000
4
Beds
1
Bath
1,600
Sq Ft
$61/Sq Ft
Est. Value
About This Home
This home is located at 2416 11th St SW, Canton, OH 44710 and is currently estimated at $97,901, approximately $61 per square foot. 2416 11th St SW is a home located in Stark County with nearby schools including Early Learning Center @ Schreiber, Cedar Elementary School, and McGregor Elementary School.
Ownership History
Date
Name
Owned For
Owner Type
Purchase Details
Closed on
Dec 5, 2023
Sold by
Mccartney Danny Jack
Bought by
Horning Stacy
Current Estimated Value
Purchase Details
Closed on
Mar 7, 2006
Sold by
Hall Timothy M
Bought by
Hud
Purchase Details
Closed on
Jul 12, 1996
Sold by
Keck Janice J
Bought by
Hall Timothy M
Home Financials for this Owner
Home Financials are based on the most recent Mortgage that was taken out on this home.
Original Mortgage
$47,050
Interest Rate
8.09%
Mortgage Type
FHA
Purchase Details
Closed on
Nov 14, 1991
Create a Home Valuation Report for This Property
The Home Valuation Report is an in-depth analysis detailing your home's value as well as a comparison with similar homes in the area
Home Values in the Area
Average Home Value in this Area
Purchase History
| Date | Buyer | Sale Price | Title Company |
|---|---|---|---|
| Horning Stacy | -- | Patriot Title | |
| Hud | $46,000 | None Available | |
| Hall Timothy M | $46,900 | -- | |
| -- | -- | -- |
Source: Public Records
Mortgage History
| Date | Status | Borrower | Loan Amount |
|---|---|---|---|
| Previous Owner | Hall Timothy M | $47,050 |
Source: Public Records
Tax History Compared to Growth
Tax History
| Year | Tax Paid | Tax Assessment Tax Assessment Total Assessment is a certain percentage of the fair market value that is determined by local assessors to be the total taxable value of land and additions on the property. | Land | Improvement |
|---|---|---|---|---|
| 2025 | $2,412 | $28,290 | $5,640 | $22,650 |
| 2024 | $965 | $28,290 | $5,640 | $22,650 |
| 2023 | $1,328 | $13,030 | $3,610 | $9,420 |
| 2022 | $777 | $13,030 | $3,610 | $9,420 |
| 2021 | $785 | $13,030 | $3,610 | $9,420 |
| 2020 | $735 | $10,920 | $3,010 | $7,910 |
| 2019 | $638 | $10,920 | $3,010 | $7,910 |
| 2018 | $648 | $10,920 | $3,010 | $7,910 |
| 2017 | $676 | $10,370 | $3,120 | $7,250 |
| 2016 | $816 | $12,500 | $3,120 | $9,380 |
| 2015 | $821 | $12,500 | $3,120 | $9,380 |
| 2014 | $867 | $12,400 | $3,120 | $9,280 |
| 2013 | $418 | $12,400 | $3,120 | $9,280 |
Source: Public Records
Map
Nearby Homes
- 1009 Arlington Ave SW
- 931 Smith Ave SW
- 2416 9th St SW
- 921 Clarendon Ave SW
- 1019 Dartmouth Ave SW
- 1238 Arlington Ave SW
- 2711 Blair Place SW
- 2310 7th St SW
- 1227 Greenfield Ave SW
- 1023 Wertz Ave SW
- 929 Wertz Ave SW
- 631 Greenfield Ave SW
- 1215 Dueber Ave SW
- 1219 Dueber Ave SW
- 2911 7th St SW
- 241 Raymont Ct SW
- 633 Park Ave SW
- 1013 Maryland Ave SW
- 846 Maryland Ave SW
- 3029 7th St SW
- 2412 11th St SW
- 2420 11th St SW
- 2424 11th St SW
- 2406 11th St SW
- 1111 Arlington Ave SW
- 2428 11th St SW
- 2400 11th St SW
- 2413 Clyde Place SW
- 2421 Clyde Place SW
- 2409 Clyde Place SW
- 2417 11th St SW
- 1117 Arlington Ave SW
- 2423 Clyde Place SW
- 2413 11th St SW
- 2419 11th St SW
- 2417 Clyde Place SW
- 2425 11th St SW
- 1039 Arlington Ave SW
- 2434 11th St SW
- 2427 11th St SW