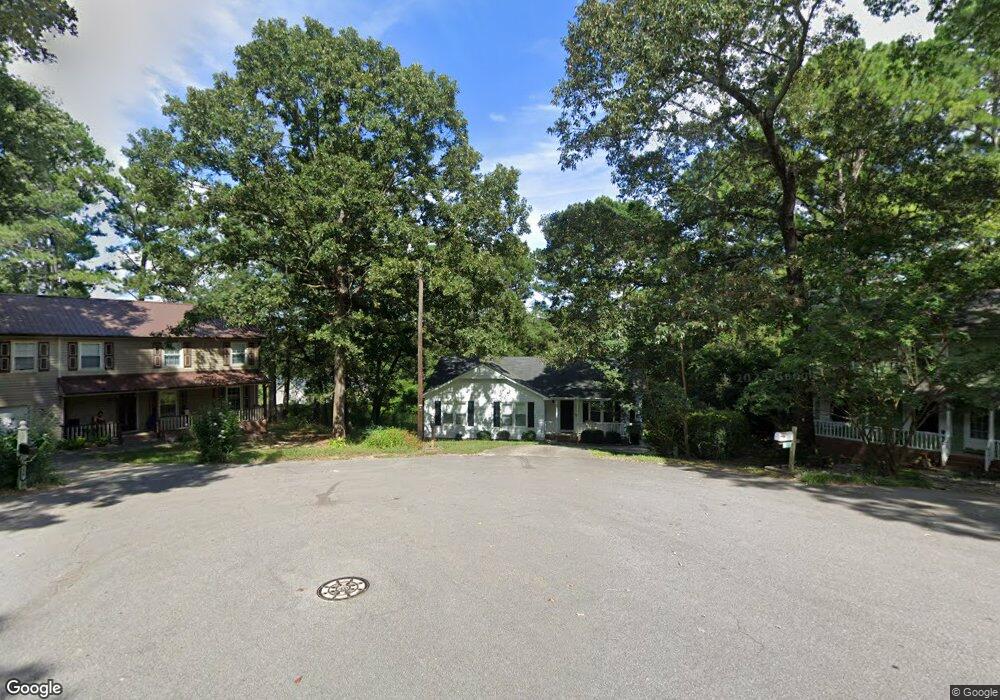
2416 Canvasback Ct Raleigh, NC 27616
Estimated Value: $285,000 - $293,000
3
Beds
2
Baths
1,346
Sq Ft
$215/Sq Ft
Est. Value
About This Home
This home is located at 2416 Canvasback Ct, Raleigh, NC 27616 and is currently estimated at $289,880, approximately $215 per square foot. 2416 Canvasback Ct is a home located in Wake County with nearby schools including Forestville Road Elementary School, Neuse River Middle School, and Knightdale High.
Ownership History
Date
Name
Owned For
Owner Type
Purchase Details
Closed on
Dec 3, 2013
Sold by
Middleton Geraldine L
Bought by
Ih2 Property North Carolina Lp
Current Estimated Value
Purchase Details
Closed on
Oct 26, 2004
Sold by
Hud
Bought by
Middleton Geraldine L
Home Financials for this Owner
Home Financials are based on the most recent Mortgage that was taken out on this home.
Original Mortgage
$84,550
Interest Rate
5.25%
Mortgage Type
New Conventional
Purchase Details
Closed on
Jul 9, 2004
Sold by
Beatty Joseph A and Beatty Joann M
Bought by
Hud
Purchase Details
Closed on
Oct 27, 2000
Sold by
Windley Joseph A
Bought by
Beatty Joseph A and Beatty Joann M
Home Financials for this Owner
Home Financials are based on the most recent Mortgage that was taken out on this home.
Original Mortgage
$98,190
Interest Rate
7.91%
Mortgage Type
FHA
Create a Home Valuation Report for This Property
The Home Valuation Report is an in-depth analysis detailing your home's value as well as a comparison with similar homes in the area
Home Values in the Area
Average Home Value in this Area
Purchase History
| Date | Buyer | Sale Price | Title Company |
|---|---|---|---|
| Ih2 Property North Carolina Lp | $90,000 | None Available | |
| Middleton Geraldine L | -- | -- | |
| Hud | $109,668 | -- | |
| Beatty Joseph A | $99,000 | -- |
Source: Public Records
Mortgage History
| Date | Status | Borrower | Loan Amount |
|---|---|---|---|
| Previous Owner | Middleton Geraldine L | $84,550 | |
| Previous Owner | Beatty Joseph A | $98,190 |
Source: Public Records
Tax History Compared to Growth
Tax History
| Year | Tax Paid | Tax Assessment Tax Assessment Total Assessment is a certain percentage of the fair market value that is determined by local assessors to be the total taxable value of land and additions on the property. | Land | Improvement |
|---|---|---|---|---|
| 2025 | $1,710 | $264,241 | $80,000 | $184,241 |
| 2024 | $1,661 | $264,241 | $80,000 | $184,241 |
| 2023 | $1,387 | $175,278 | $35,000 | $140,278 |
| 2022 | $1,286 | $175,278 | $35,000 | $140,278 |
| 2021 | $1,252 | $175,278 | $35,000 | $140,278 |
| 2020 | $1,231 | $175,278 | $35,000 | $140,278 |
| 2019 | $1,124 | $135,236 | $38,000 | $97,236 |
| 2018 | $1,035 | $135,236 | $38,000 | $97,236 |
| 2017 | $982 | $135,236 | $38,000 | $97,236 |
| 2016 | $962 | $135,236 | $38,000 | $97,236 |
| 2015 | $917 | $129,223 | $28,000 | $101,223 |
| 2014 | $870 | $129,223 | $28,000 | $101,223 |
Source: Public Records
Map
Nearby Homes
- 4208 Bluewing Rd
- 4457 Labrador Dr
- 2616 Lizei St
- 4317 Snow Goose Ct
- 2028 Ruddy Rd
- 3917 Mount Moran Rd
- 4004 Mount Moran Rd
- 3932 Mount Moran Rd
- 4356 Coldwater Springs Dr
- 7727 Weathered Oak Way
- 4348 Coldwater Springs Dr
- 7725 Weathered Oak Way
- 4344 Coldwater Springs Dr
- 7817 Elmshire Way
- 4340 Coldwater Springs Dr
- 4345 Coldwater Springs Dr
- 7661 Mapleshire Dr
- 7454 Randshire Way
- 4332 Coldwater Springs Dr
- 4341 Coldwater Springs Dr
- 2425 Canvasback Ct
- 2412 Canvasback Ct
- 2421 Canvasback Ct
- 2408 Canvasback Ct
- 2417 Canvasback Ct
- 4313 Bluewing Rd
- 4309 Bluewing Rd
- 4220 Mcgrath Way
- 2413 Canvasback Ct
- 4216 Mcgrath Way
- 2404 Canvasback Ct
- 4305 Bluewing Rd
- 4317 Bluewing Rd
- 4212 Mcgrath Way
- 4301 Bluewing Rd
- 4225 Bluewing Rd
- 2409 Canvasback Ct
- 4224 Mcgrath Way
- 2400 Canvasback Ct
- 4320 Bluewing Rd