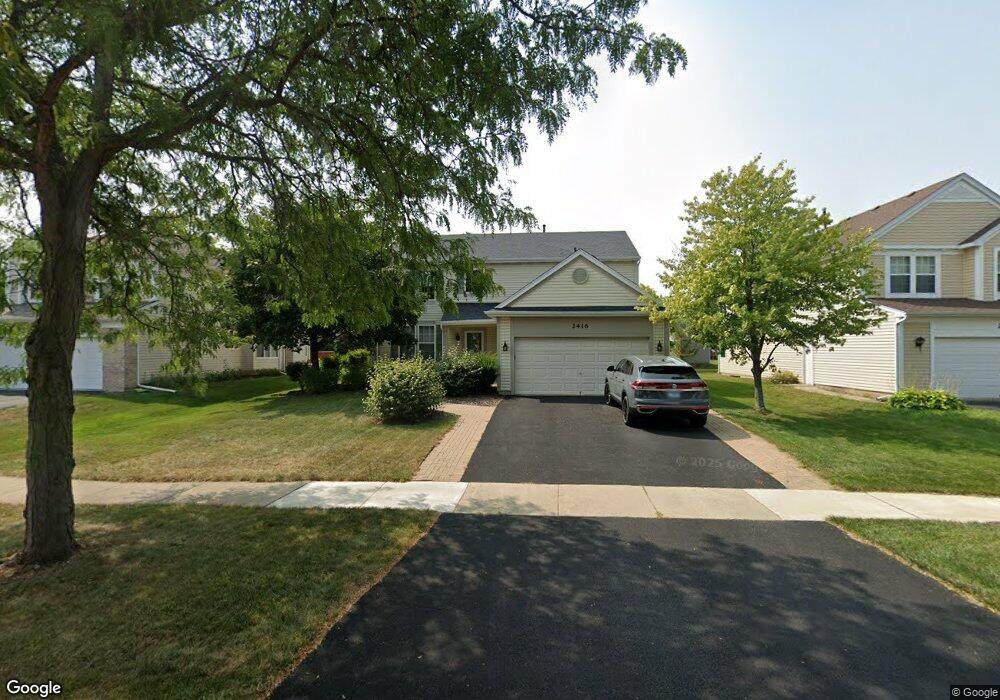
2416 Lexington Ln Unit 1 Naperville, IL 60540
West Sanctuary Lane NeighborhoodEstimated Value: $533,000 - $621,201
4
Beds
3
Baths
2,364
Sq Ft
$248/Sq Ft
Est. Value
About This Home
This home is located at 2416 Lexington Ln Unit 1, Naperville, IL 60540 and is currently estimated at $586,550, approximately $248 per square foot. 2416 Lexington Ln Unit 1 is a home located in DuPage County with nearby schools including Mary Lou Cowlishaw Elementary School, Still Middle School, and Metea Valley High School.
Ownership History
Date
Name
Owned For
Owner Type
Purchase Details
Closed on
Jan 28, 2005
Sold by
Myers Mitch N and Myers Linda Anne
Bought by
Ogundare David A and Ogundare Sarah O
Current Estimated Value
Home Financials for this Owner
Home Financials are based on the most recent Mortgage that was taken out on this home.
Original Mortgage
$273,600
Outstanding Balance
$139,798
Interest Rate
5.83%
Mortgage Type
Purchase Money Mortgage
Estimated Equity
$446,752
Purchase Details
Closed on
Aug 26, 1998
Sold by
Meyers Mitch N
Bought by
Myers Mitch N and Myers Linda Anne
Purchase Details
Closed on
Feb 14, 1995
Sold by
Cole Taylor Bank
Bought by
Myers Mitch N
Home Financials for this Owner
Home Financials are based on the most recent Mortgage that was taken out on this home.
Original Mortgage
$165,500
Interest Rate
9.12%
Create a Home Valuation Report for This Property
The Home Valuation Report is an in-depth analysis detailing your home's value as well as a comparison with similar homes in the area
Home Values in the Area
Average Home Value in this Area
Purchase History
| Date | Buyer | Sale Price | Title Company |
|---|---|---|---|
| Ogundare David A | $342,000 | Law Title | |
| Myers Mitch N | -- | Stewart Title Company | |
| Myers Mitch N | $195,000 | -- |
Source: Public Records
Mortgage History
| Date | Status | Borrower | Loan Amount |
|---|---|---|---|
| Open | Ogundare David A | $273,600 | |
| Previous Owner | Myers Mitch N | $165,500 |
Source: Public Records
Tax History Compared to Growth
Tax History
| Year | Tax Paid | Tax Assessment Tax Assessment Total Assessment is a certain percentage of the fair market value that is determined by local assessors to be the total taxable value of land and additions on the property. | Land | Improvement |
|---|---|---|---|---|
| 2024 | $9,751 | $172,210 | $45,651 | $126,559 |
| 2023 | $9,276 | $154,740 | $41,020 | $113,720 |
| 2022 | $9,631 | $146,920 | $38,640 | $108,280 |
| 2021 | $9,326 | $141,680 | $37,260 | $104,420 |
| 2020 | $9,314 | $141,680 | $37,260 | $104,420 |
| 2019 | $8,945 | $134,750 | $35,440 | $99,310 |
| 2018 | $8,906 | $131,820 | $33,900 | $97,920 |
| 2017 | $8,660 | $127,350 | $32,750 | $94,600 |
| 2016 | $8,502 | $122,220 | $31,430 | $90,790 |
| 2015 | $8,420 | $116,040 | $29,840 | $86,200 |
| 2014 | $8,016 | $107,120 | $27,330 | $79,790 |
| 2013 | $7,998 | $107,860 | $27,520 | $80,340 |
Source: Public Records
Map
Nearby Homes
- 822 Shandrew Dr Unit 103
- 858 Shandrew Dr Unit 405
- 2628 Blakely Ln Unit 1002
- 804 Paisley Ct
- 2525 Dunraven Ave
- 895 Lowell Ln
- 939 Lowell Ln Unit 3
- 2783 Blakely Ln Unit 34
- 712 Blossom Ct Unit 243
- 808 Violet Cir
- 1259 Lakewood Cir
- 2925 Henley Ln
- 1712 Chepstow Ct
- 912 Sanctuary Ln Unit 3
- 1163 Whispering Hills Dr Unit 127
- 1427 Ada Ln
- 1500 Sequoia Rd
- 459 Plaza Place
- 9S151 Skylane Dr
- 695 Station Blvd
- 2412 Lexington Ln
- 2420 Lexington Ln
- 908 John Friend Dr
- 2424 Lexington Ln
- 912 John Friend Dr Unit 1
- 904 John Friend Dr
- 2464 Emerson Ln
- 916 John Friend Dr
- 2404 Lexington Ln
- 851 Fieldcrest Dr
- 920 John Friend Dr
- 2459 Emerson Ln
- 2460 Emerson Ln
- 2352 Lexington Ln
- 847 Fieldcrest Dr
- 928 John Friend Dr
- 2455 Emerson Ln
- 2456 Emerson Ln
- 2504 Lexington Ln Unit 4