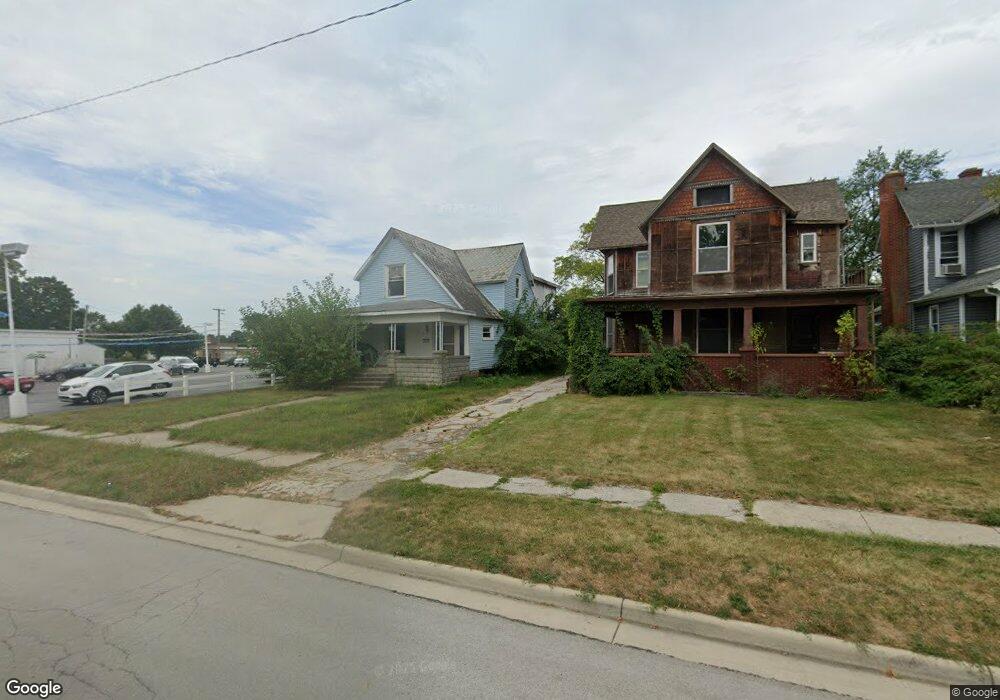
2416 N Main St Findlay, OH 45840
Estimated Value: $156,886 - $199,000
4
Beds
2
Baths
1,794
Sq Ft
$102/Sq Ft
Est. Value
About This Home
This home is located at 2416 N Main St, Findlay, OH 45840 and is currently estimated at $182,722, approximately $101 per square foot. 2416 N Main St is a home located in Hancock County with nearby schools including Northview Elementary School, Bigelow Hill Elementary School, and Glenwood Middle School.
Ownership History
Date
Name
Owned For
Owner Type
Purchase Details
Closed on
Mar 30, 2023
Sold by
Moody Eve
Bought by
Dg Property Group Llc
Current Estimated Value
Purchase Details
Closed on
May 11, 2022
Sold by
Sandra Butler
Bought by
Moody Eve
Purchase Details
Closed on
Aug 17, 2021
Sold by
Dillery Carol A and U S Bank Trust National Associ
Bought by
Butler Sandra A
Purchase Details
Closed on
Mar 21, 2017
Bought by
Carol A Dillery
Purchase Details
Closed on
Feb 22, 1985
Bought by
Dillery Harold F and Dillery Carol A
Purchase Details
Closed on
Sep 11, 1981
Bought by
Delaney Fred J
Create a Home Valuation Report for This Property
The Home Valuation Report is an in-depth analysis detailing your home's value as well as a comparison with similar homes in the area
Home Values in the Area
Average Home Value in this Area
Purchase History
We collect this data history from publicly available records. To have your information removed, we recommend requesting removal directly through your county’s website.
| Date | Buyer | Sale Price | Title Company |
|---|---|---|---|
| Dg Property Group Llc | $14,000 | -- | |
| Moody Eve | $42,000 | None Listed On Document | |
| Butler Sandra A | $53,185 | None Available | |
| Carol A Dillery | -- | -- | |
| Dillery Harold F | $26,000 | -- | |
| Delaney Fred J | -- | -- |
Source: Public Records
Tax History
| Year | Tax Paid | Tax Assessment Tax Assessment Total Assessment is a certain percentage of the fair market value that is determined by local assessors to be the total taxable value of land and additions on the property. | Land | Improvement |
|---|---|---|---|---|
| 2025 | $1,724 | $54,740 | $6,000 | $48,740 |
| 2024 | $1,543 | $42,330 | $4,800 | $37,530 |
| 2023 | $546 | $14,940 | $4,800 | $10,140 |
| 2022 | $544 | $14,940 | $4,800 | $10,140 |
| 2021 | $1,566 | $37,490 | $4,800 | $32,690 |
| 2020 | $1,526 | $37,490 | $4,800 | $32,690 |
| 2019 | $1,495 | $37,490 | $4,800 | $32,690 |
| 2018 | $1,417 | $32,600 | $4,170 | $28,430 |
| 2017 | $1,417 | $32,600 | $4,170 | $28,430 |
| 2016 | $1,431 | $32,600 | $4,170 | $28,430 |
| 2015 | $976 | $22,320 | $4,170 | $18,150 |
| 2014 | $976 | $22,320 | $4,170 | $18,150 |
| 2012 | $984 | $22,320 | $4,170 | $18,150 |
Source: Public Records
Map
Nearby Homes
- 2316 N Main St
- 2400 Hollybrook Dr
- 2419 Hollybrook Dr
- 228 Edinborough Dr
- 241 Stanley Ave
- 2019 N Main St
- 351 Mona Ln
- 1934 Geffs Ave
- 408 Edith Ave
- 323 W Bigelow Ave
- 1907 Candlewick Dr
- 118 Clifton Ave
- 225 19th St
- 146 Clifton Ave
- 410 Prentiss Ave
- 140 Monroe Ave
- 206 Terrace Dr
- 2411 Villa West Dr
- 151 Monroe Ave
- 525 Rector Ave
- 2500 N Main St
- 2504 N Main St
- 2512 Nmain
- 2512 N Main St
- 2421 Grace Blvd
- 2429 Grace Blvd
- 2417 Grace Blvd
- 126 Lexington Ave
- 2431 Grace Blvd
- 2435 Grace Blvd
- 2520 N Main St
- 130 Lexington Ave
- 2411 N Main St
- 2445 Grace Blvd
- 2400 N Main St
- 2407 N Main St
- 2528 N Main St
- 2320 N Main St
- 2401 N Main St
- 2401 N Main St
Your Personal Tour Guide
Ask me questions while you tour the home.