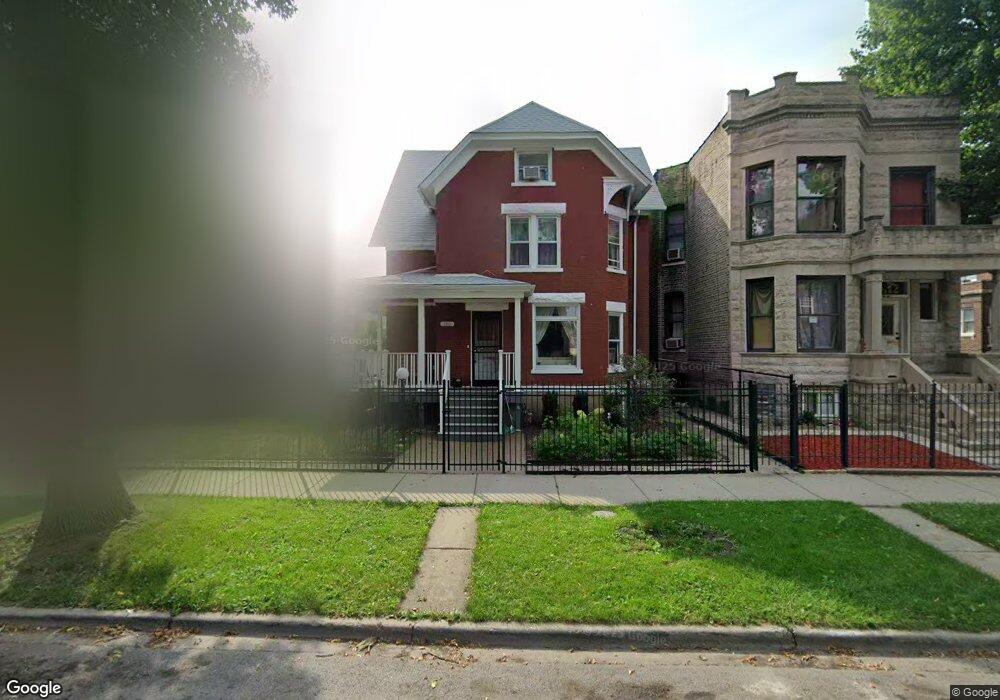
2416 S Ridgeway Ave Chicago, IL 60623
Little Village NeighborhoodEstimated Value: $242,000 - $398,000
4
Beds
2
Baths
2,605
Sq Ft
$124/Sq Ft
Est. Value
About This Home
This home is located at 2416 S Ridgeway Ave, Chicago, IL 60623 and is currently estimated at $321,946, approximately $123 per square foot. 2416 S Ridgeway Ave is a home located in Cook County with nearby schools including Cardenas Elementary School and St. Agnes of Bohemia School.
Ownership History
Date
Name
Owned For
Owner Type
Purchase Details
Closed on
May 23, 2016
Sold by
Greeley Kara W and Greeley Siri Atma
Bought by
Atg Trust Co
Current Estimated Value
Home Financials for this Owner
Home Financials are based on the most recent Mortgage that was taken out on this home.
Original Mortgage
$124,000
Outstanding Balance
$98,487
Interest Rate
3.59%
Mortgage Type
New Conventional
Estimated Equity
$223,459
Purchase Details
Closed on
May 16, 2016
Sold by
Alley John S and Alley Sarah H
Bought by
Greeley Kara W and Greeley Siri Atma
Home Financials for this Owner
Home Financials are based on the most recent Mortgage that was taken out on this home.
Original Mortgage
$124,000
Outstanding Balance
$98,487
Interest Rate
3.59%
Mortgage Type
New Conventional
Estimated Equity
$223,459
Purchase Details
Closed on
Mar 16, 2005
Sold by
Ailey John S and Ailey Sarah H
Bought by
Ailey John S and Ailey Sarah H
Create a Home Valuation Report for This Property
The Home Valuation Report is an in-depth analysis detailing your home's value as well as a comparison with similar homes in the area
Home Values in the Area
Average Home Value in this Area
Purchase History
| Date | Buyer | Sale Price | Title Company |
|---|---|---|---|
| Atg Trust Co | -- | None Available | |
| Greeley Kara W | $250,000 | Chicago Title | |
| Ailey John S | -- | -- |
Source: Public Records
Mortgage History
| Date | Status | Borrower | Loan Amount |
|---|---|---|---|
| Open | Greeley Kara W | $124,000 |
Source: Public Records
Tax History Compared to Growth
Tax History
| Year | Tax Paid | Tax Assessment Tax Assessment Total Assessment is a certain percentage of the fair market value that is determined by local assessors to be the total taxable value of land and additions on the property. | Land | Improvement |
|---|---|---|---|---|
| 2024 | $1,832 | $31,000 | $10,694 | $20,306 |
| 2023 | $1,764 | $12,849 | $6,168 | $6,681 |
| 2022 | $1,764 | $12,849 | $6,168 | $6,681 |
| 2021 | $1,743 | $11,997 | $6,165 | $5,832 |
| 2020 | $3,951 | $20,837 | $8,665 | $12,172 |
| 2019 | $4,068 | $23,679 | $8,665 | $15,014 |
| 2018 | $3,999 | $23,679 | $8,665 | $15,014 |
| 2017 | $4,089 | $18,997 | $7,743 | $11,254 |
| 2016 | $3,305 | $18,997 | $7,743 | $11,254 |
| 2015 | $3,000 | $18,997 | $7,743 | $11,254 |
| 2014 | $2,893 | $18,160 | $7,375 | $10,785 |
| 2013 | $2,825 | $18,160 | $7,375 | $10,785 |
Source: Public Records
Map
Nearby Homes
- 1808 S Hamlin Ave
- 2352 S Lawndale Ave
- 2536 S Avers Ave
- 3854 W 24th St
- 2345 S Lawndale Ave
- 2541 S Springfield Ave
- 2246 S Ridgeway Ave
- 2107 S Harding Ave
- 2631 S Avers Ave
- 2238 S Ridgeway Ave
- 2301 S Millard Ave
- 2632 S Millard Ave
- 2436 S Pulaski Rd
- 2434 S Pulaski Rd
- 2221 S Springfield Ave
- 3723 W Cermak Rd
- 2711 S Hamlin Ave
- 3736 W Cermak Rd
- 1647 S Drake Ave
- 3700 W Cermak Rd Unit 1
- 2422 S Ridgeway Ave
- 2412 S Ridgeway Ave
- 2412 S Ridgeway Ave
- 2426 S Ridgeway Ave Unit 1
- 2406 S Ridgeway Ave
- 2419 S Hamlin Ave
- 2417 S Hamlin Ave
- 2432 S Ridgeway Ave
- 2423 S Hamlin Ave
- 2423 S Hamlin Ave Unit 1
- 2423 S Hamlin Ave
- 2411 S Hamlin Ave
- 2402 S Ridgeway Ave
- 2409 S Hamlin Ave
- 2425 S Hamlin Ave Unit 2
- 2427 S Hamlin Ave Unit 2
- 2417 S Ridgeway Ave
- 2429 S Hamlin Ave
- 2413 S Ridgeway Ave
- 2405 S Hamlin Ave