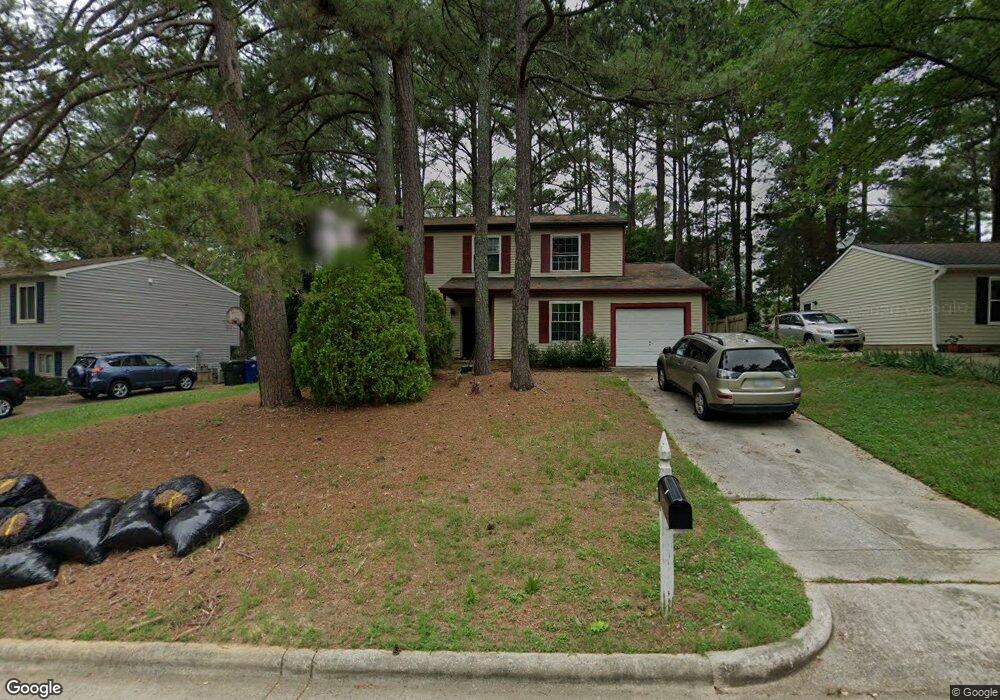
2416 Tusket Ct Raleigh, NC 27613
Estimated Value: $429,000 - $510,000
4
Beds
3
Baths
2,034
Sq Ft
$226/Sq Ft
Est. Value
About This Home
This home is located at 2416 Tusket Ct, Raleigh, NC 27613 and is currently estimated at $459,521, approximately $225 per square foot. 2416 Tusket Ct is a home located in Wake County with nearby schools including Lynn Road Elementary School, Carroll Middle, and Sanderson High School.
Ownership History
Date
Name
Owned For
Owner Type
Purchase Details
Closed on
Jan 13, 2006
Sold by
Hud
Bought by
Al Hammami Musab
Current Estimated Value
Home Financials for this Owner
Home Financials are based on the most recent Mortgage that was taken out on this home.
Original Mortgage
$158,000
Outstanding Balance
$98,197
Interest Rate
8.12%
Mortgage Type
Fannie Mae Freddie Mac
Estimated Equity
$361,324
Purchase Details
Closed on
Jul 18, 2005
Sold by
Ventura Jose M and Ventura Maria
Bought by
Hud
Purchase Details
Closed on
Apr 7, 1999
Sold by
Mondo Gregory J
Bought by
Ventura Jose Mario and Ventura Maria Soleda
Home Financials for this Owner
Home Financials are based on the most recent Mortgage that was taken out on this home.
Original Mortgage
$135,880
Interest Rate
7.13%
Mortgage Type
FHA
Create a Home Valuation Report for This Property
The Home Valuation Report is an in-depth analysis detailing your home's value as well as a comparison with similar homes in the area
Home Values in the Area
Average Home Value in this Area
Purchase History
| Date | Buyer | Sale Price | Title Company |
|---|---|---|---|
| Al Hammami Musab | -- | None Available | |
| Hud | $145,573 | None Available | |
| Ventura Jose Mario | $137,000 | -- |
Source: Public Records
Mortgage History
| Date | Status | Borrower | Loan Amount |
|---|---|---|---|
| Open | Al Hammami Musab | $158,000 | |
| Previous Owner | Ventura Jose Mario | $135,880 |
Source: Public Records
Tax History Compared to Growth
Tax History
| Year | Tax Paid | Tax Assessment Tax Assessment Total Assessment is a certain percentage of the fair market value that is determined by local assessors to be the total taxable value of land and additions on the property. | Land | Improvement |
|---|---|---|---|---|
| 2025 | $3,438 | $391,952 | $200,000 | $191,952 |
| 2024 | $3,424 | $391,952 | $200,000 | $191,952 |
| 2023 | $2,684 | $244,393 | $97,000 | $147,393 |
| 2022 | $2,494 | $244,393 | $97,000 | $147,393 |
| 2021 | $2,398 | $244,393 | $97,000 | $147,393 |
| 2020 | $2,354 | $244,393 | $97,000 | $147,393 |
| 2019 | $2,167 | $185,303 | $75,000 | $110,303 |
| 2018 | $2,045 | $185,303 | $75,000 | $110,303 |
| 2017 | $1,948 | $185,303 | $75,000 | $110,303 |
| 2016 | $1,908 | $204,009 | $75,000 | $129,009 |
| 2015 | $1,942 | $185,596 | $56,000 | $129,596 |
| 2014 | $1,842 | $185,596 | $56,000 | $129,596 |
Source: Public Records
Map
Nearby Homes
- 2428 Havershire Dr
- 8920 Taymouth Ct
- 2609 Cobworth Ct
- 2610 Sawmill Rd
- 7741 Wilderness Rd
- 7740 Wilderness Rd
- 6924 Three Bridges Cir
- 7401 Ray Rd
- 6502 Brecken Pines Ct
- 6909 Woodmere Dr
- 7601 Valview St
- 7922 Footman Way
- 7628 Valview St
- 2204 Middlefield Ct
- 6925 Valley Lake Dr
- 6505 Burnette Flower Way
- 6501 Burnette Flower Way
- 6304 Ansley Ln
- 1701 Burnette Garden Path
- 1705 Burnette Garden Path
- 2412 Tusket Ct
- 2420 Tusket Ct
- 8708 Bucksport Ln
- 2408 Tusket Ct
- 2424 Tusket Ct
- 8712 Bucksport Ln
- 8609 Keegan Ct
- 8716 Bucksport Ln
- 2404 Tusket Ct
- 2428 Tusket Ct
- 2417 Tusket Ct
- 8605 Keegan Ct
- 8700 Bucksport Ln
- 2421 Tusket Ct
- 2425 Tusket Ct
- 8709 Bucksport Ln
- 2400 Tusket Ct
- 8713 Bucksport Ln
- 2405 Boothbay Ct
- 2409 Boothbay Ct