2417 4th St Livermore, CA 94550
Downtown Livermore NeighborhoodEstimated Value: $756,269 - $1,010,000
2
Beds
1
Bath
832
Sq Ft
$1,035/Sq Ft
Est. Value
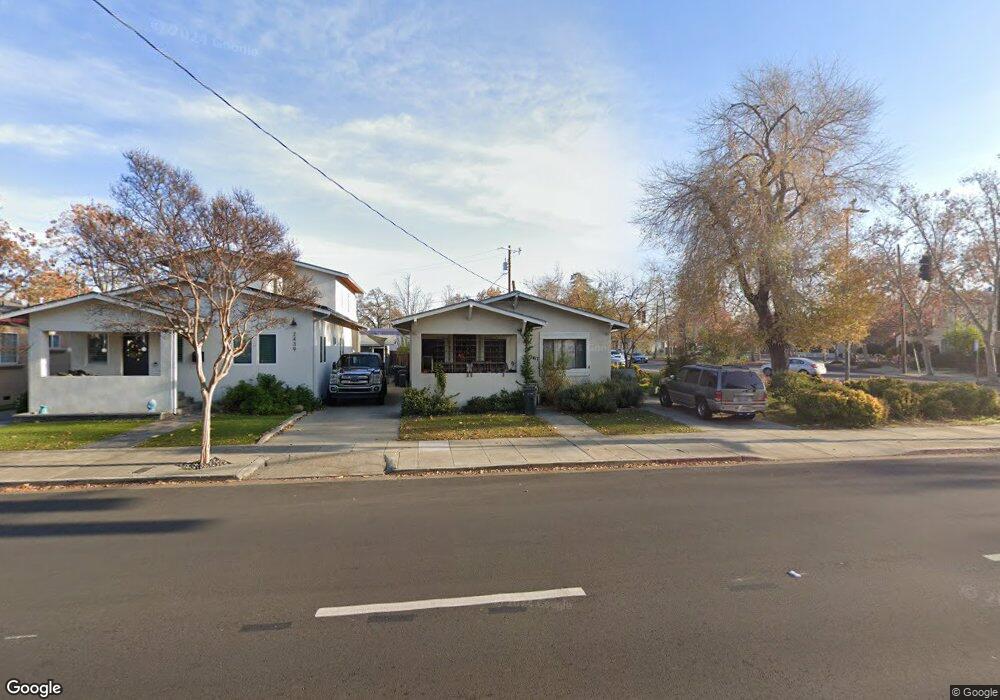
About This Home
This home is located at 2417 4th St, Livermore, CA 94550 and is currently estimated at $861,067, approximately $1,034 per square foot. 2417 4th St is a home located in Alameda County with nearby schools including Jackson Avenue Elementary School, East Avenue Middle School, and Livermore High School.
Ownership History
Date
Name
Owned For
Owner Type
Purchase Details
Closed on
Sep 26, 2018
Sold by
Adams William Jeffrey and Adams Jillynn R
Bought by
Adams William Jeffrey and Adams Jillynn R
Current Estimated Value
Home Financials for this Owner
Home Financials are based on the most recent Mortgage that was taken out on this home.
Original Mortgage
$99,000
Outstanding Balance
$86,334
Interest Rate
4.5%
Mortgage Type
Credit Line Revolving
Estimated Equity
$774,733
Purchase Details
Closed on
Apr 2, 2009
Sold by
Adams Renee L and The Renee L Adams Revocable Tr
Bought by
Adams William Jeffrey and Adams Jillynn R
Home Financials for this Owner
Home Financials are based on the most recent Mortgage that was taken out on this home.
Original Mortgage
$165,000
Interest Rate
5.04%
Mortgage Type
Seller Take Back
Purchase Details
Closed on
Dec 12, 2007
Sold by
Preftokis Louis Stanley and Preftokis Trust Agreement
Bought by
Adams William Jeffrey and Adams Stephanie Elise
Create a Home Valuation Report for This Property
The Home Valuation Report is an in-depth analysis detailing your home's value as well as a comparison with similar homes in the area
Home Values in the Area
Average Home Value in this Area
Purchase History
| Date | Buyer | Sale Price | Title Company |
|---|---|---|---|
| Adams William Jeffrey | -- | North American Title Company | |
| Adams William Jeffrey | $165,000 | None Available | |
| Adams William Jeffrey | -- | None Available |
Source: Public Records
Mortgage History
| Date | Status | Borrower | Loan Amount |
|---|---|---|---|
| Open | Adams William Jeffrey | $99,000 | |
| Closed | Adams William Jeffrey | $165,000 |
Source: Public Records
Tax History
| Year | Tax Paid | Tax Assessment Tax Assessment Total Assessment is a certain percentage of the fair market value that is determined by local assessors to be the total taxable value of land and additions on the property. | Land | Improvement |
|---|---|---|---|---|
| 2025 | $5,221 | $359,979 | $148,184 | $211,795 |
| 2024 | $5,221 | $352,922 | $145,279 | $207,643 |
| 2023 | $5,144 | $346,003 | $142,431 | $203,572 |
| 2022 | $5,329 | $339,221 | $139,639 | $199,582 |
| 2021 | $4,204 | $332,570 | $136,901 | $195,669 |
| 2020 | $4,790 | $329,161 | $135,498 | $193,663 |
| 2019 | $4,814 | $322,709 | $132,842 | $189,867 |
| 2018 | $4,694 | $316,384 | $130,238 | $186,146 |
| 2017 | $4,584 | $310,181 | $127,685 | $182,496 |
| 2016 | $4,671 | $304,101 | $125,182 | $178,919 |
| 2015 | $4,142 | $299,536 | $123,303 | $176,233 |
| 2014 | $4,086 | $293,670 | $120,888 | $172,782 |
Source: Public Records
Map
Nearby Homes
- 2235 4th St
- 2463 6th St
- 772 Mcleod St
- 2342 Palm Ave
- 2871 1st St Unit 901
- 820 Arbor Ct
- 2211 College Ave
- 161 N L St Unit 115
- 2155 Chestnut St
- 3628 Carrigan Common
- 874 Mendenhall Dr
- 2290 Chateau Way
- 157 Zephyr Place Unit 109
- 843 Jensen St
- 1766 College Ave
- 112 Martin Ave
- 170 N N St Unit 102
- 3797 Oregon Way
- 3610 Madeira Way
- 0 Gardella Plaza
Your Personal Tour Guide
Ask me questions while you tour the home.