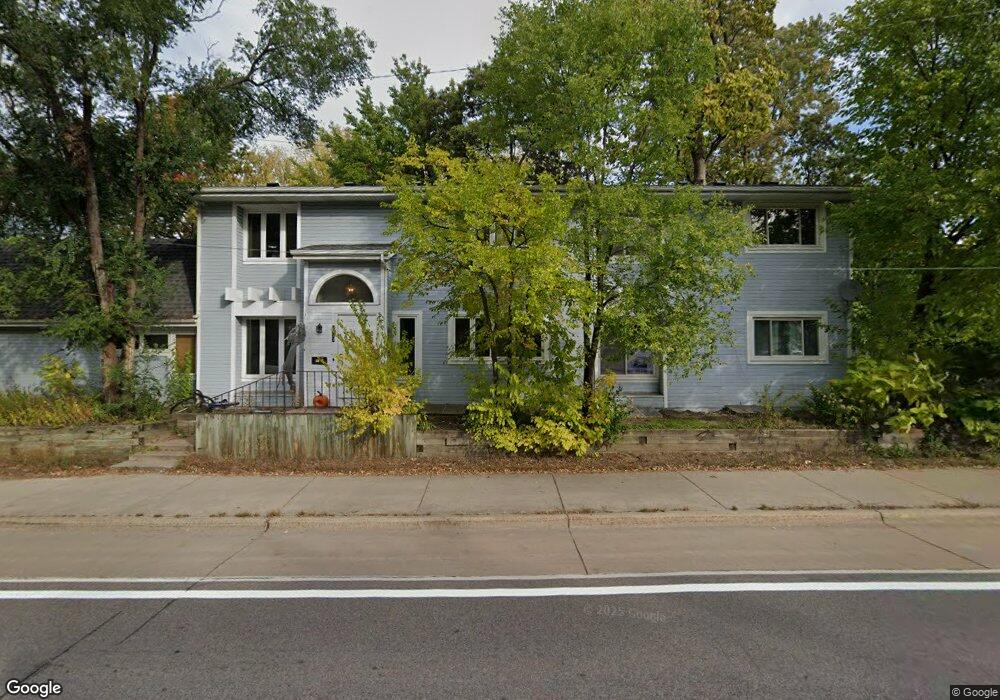
2417 Como Ave SE Minneapolis, MN 55414
Como NeighborhoodEstimated Value: $461,000 - $614,000
8
Beds
4
Baths
3,358
Sq Ft
$159/Sq Ft
Est. Value
About This Home
This home is located at 2417 Como Ave SE, Minneapolis, MN 55414 and is currently estimated at $532,922, approximately $158 per square foot. 2417 Como Ave SE is a home located in Hennepin County with nearby schools including Pillsbury Elementary School, Northeast Middle School, and Thomas Edison High School.
Ownership History
Date
Name
Owned For
Owner Type
Purchase Details
Closed on
Oct 11, 2022
Sold by
Edman Teri
Bought by
Ef Holdings 1 Llc
Current Estimated Value
Purchase Details
Closed on
Dec 15, 2021
Sold by
Abraham Kyle M and Abraham Kristin B
Bought by
Edman Teri
Purchase Details
Closed on
May 21, 2021
Sold by
Abraham Kyle M and Abraham Kristin B
Bought by
Abraham Kyle M and Abraham Kristin B
Purchase Details
Closed on
Jul 24, 2020
Sold by
Carpenter Rentals Llc
Bought by
Abraham Kyle M and Abraham Kristin B
Home Financials for this Owner
Home Financials are based on the most recent Mortgage that was taken out on this home.
Original Mortgage
$300,000
Interest Rate
3.1%
Mortgage Type
New Conventional
Purchase Details
Closed on
Jul 29, 2005
Sold by
Radabaugh Jesse M
Bought by
Abraham Kyle M and Abraham Kristin B
Purchase Details
Closed on
Jul 25, 1996
Sold by
Spalding John P and Carol Spalding R
Bought by
Radabaugh Jesse M and Devine Shawn P
Create a Home Valuation Report for This Property
The Home Valuation Report is an in-depth analysis detailing your home's value as well as a comparison with similar homes in the area
Home Values in the Area
Average Home Value in this Area
Purchase History
| Date | Buyer | Sale Price | Title Company |
|---|---|---|---|
| Ef Holdings 1 Llc | $500 | -- | |
| Edman Teri | $525,000 | Trademark Title Services Inc | |
| Abraham Kyle M | -- | None Listed On Document | |
| Abraham Kyle M | -- | Burnet Title | |
| Abraham Kyle M | $399,900 | -- | |
| Radabaugh Jesse M | $164,500 | -- |
Source: Public Records
Mortgage History
| Date | Status | Borrower | Loan Amount |
|---|---|---|---|
| Previous Owner | Abraham Kyle M | $300,000 |
Source: Public Records
Tax History Compared to Growth
Tax History
| Year | Tax Paid | Tax Assessment Tax Assessment Total Assessment is a certain percentage of the fair market value that is determined by local assessors to be the total taxable value of land and additions on the property. | Land | Improvement |
|---|---|---|---|---|
| 2024 | $9,321 | $499,000 | $66,000 | $433,000 |
| 2023 | $8,254 | $516,000 | $66,000 | $450,000 |
| 2022 | $6,371 | $369,000 | $55,000 | $314,000 |
| 2021 | $6,368 | $375,000 | $33,000 | $342,000 |
| 2020 | $6,619 | $374,500 | $43,100 | $331,400 |
| 2019 | $6,180 | $374,500 | $28,700 | $345,800 |
| 2018 | $5,529 | $340,500 | $28,700 | $311,800 |
| 2017 | $5,689 | $291,000 | $26,100 | $264,900 |
| 2016 | $5,873 | $291,000 | $26,100 | $264,900 |
| 2015 | $6,161 | $291,000 | $26,100 | $264,900 |
| 2014 | -- | $291,000 | $26,100 | $264,900 |
Source: Public Records
Map
Nearby Homes
- 2500 Como Ave SE
- 1038 23rd Ave SE
- 2418 Cole Ave SE
- 850 22nd Ave SE
- 1070 21st Ave SE
- 983 18th Ave SE
- 1090 16th Ave SE
- 1034 14th Ave SE
- 1081 13th Ave SE
- 1173 14th Ave SE
- 730 Stinson Blvd Unit 314
- 730 Stinson Blvd Unit 103
- 730 Stinson Blvd Unit 320
- 730 Stinson Blvd Unit 106
- 730 Stinson Blvd Unit 516
- 730 Stinson Blvd Unit 319
- 1821 Malvern St
- 2394 Valentine Ave
- 1803 Eustis St
- 2420 Como Ave
- 1005 25th Ave SE
- 1009 25th Ave SE
- 1011 25th Ave SE
- xxx 25th Ave SE
- 1000 24th Ave SE
- 1006 24th Ave SE
- 2414 Como Ave SE
- 2420 Como Ave SE
- 2410 Como Ave SE
- 2501 Como Ave SE
- 1017 25th Ave SE
- 1010 24th Ave SE
- 1014 24th Ave SE
- 1014 24th Ave SE Unit 2
- 2505 Como Ave SE
- 1021 25th Ave SE
- 1016 24th Ave SE
- 1012 25th Ave SE
- 923 25th Ave SE
- 1025 25th Ave SE