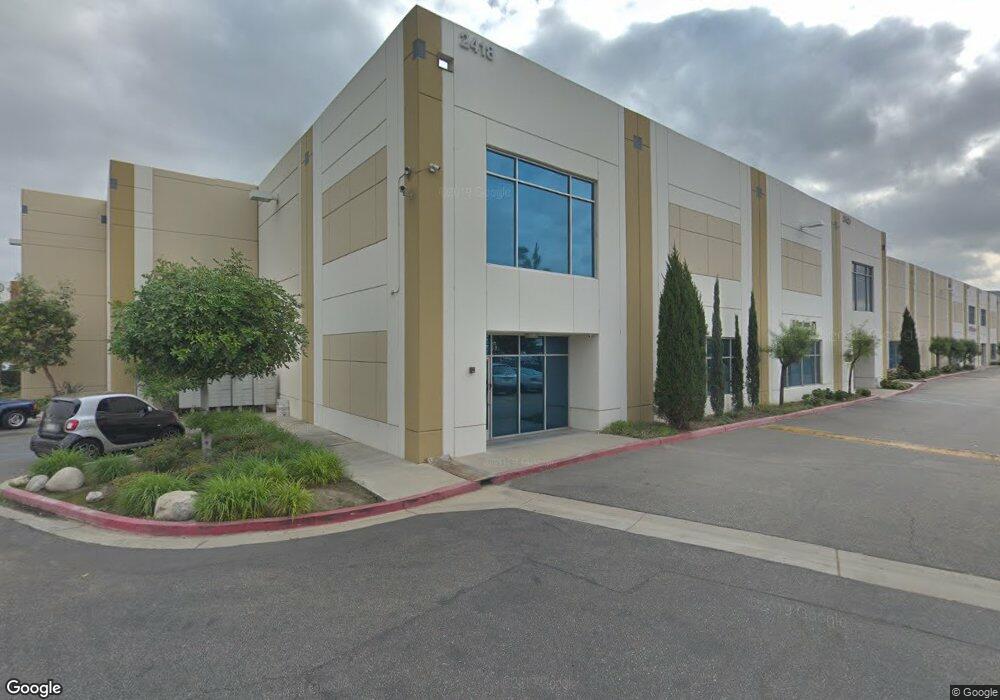
2418 Peck Rd City of Industry, CA 90601
--
Bed
--
Bath
260,389
Sq Ft
2.02
Acres
About This Home
This home is located at 2418 Peck Rd, City of Industry, CA 90601. 2418 Peck Rd is a home located in Los Angeles County with nearby schools including Mill Elementary School, Walter F. Dexter Middle School, and Pioneer High School.
Ownership History
Date
Name
Owned For
Owner Type
Purchase Details
Closed on
Feb 1, 2018
Sold by
Charles Dunn Equities I Llc
Bought by
Ppf Industrial Peck Center I Lp
Purchase Details
Closed on
Sep 5, 2002
Sold by
Inimco
Bought by
Charles Dunn Equities 1 Llc
Purchase Details
Closed on
Sep 18, 2001
Sold by
Wells Fargo Bank Na
Bought by
Inimco Corp
Home Financials for this Owner
Home Financials are based on the most recent Mortgage that was taken out on this home.
Original Mortgage
$1,100,000
Interest Rate
6.99%
Mortgage Type
Commercial
Purchase Details
Closed on
May 7, 1997
Sold by
Wells Fargo Bank Na
Bought by
Wells Fargo Bank Na and First Interstate Bank Of California
Create a Home Valuation Report for This Property
The Home Valuation Report is an in-depth analysis detailing your home's value as well as a comparison with similar homes in the area
Home Values in the Area
Average Home Value in this Area
Purchase History
| Date | Buyer | Sale Price | Title Company |
|---|---|---|---|
| Ppf Industrial Peck Center I Lp | $24,587,000 | None Available | |
| Charles Dunn Equities 1 Llc | -- | -- | |
| Inimco Corp | -- | Old Republic Title Company | |
| Wells Fargo Bank Na | -- | -- |
Source: Public Records
Mortgage History
| Date | Status | Borrower | Loan Amount |
|---|---|---|---|
| Previous Owner | Inimco Corp | $1,100,000 |
Source: Public Records
Tax History Compared to Growth
Tax History
| Year | Tax Paid | Tax Assessment Tax Assessment Total Assessment is a certain percentage of the fair market value that is determined by local assessors to be the total taxable value of land and additions on the property. | Land | Improvement |
|---|---|---|---|---|
| 2025 | $245,361 | $20,540,072 | $2,260,100 | $18,279,972 |
| 2024 | $245,361 | $20,137,327 | $2,215,785 | $17,921,542 |
| 2023 | $240,870 | $19,742,479 | $2,172,339 | $17,570,140 |
| 2022 | $236,051 | $19,355,373 | $2,129,745 | $17,225,628 |
| 2021 | $328,046 | $18,975,857 | $2,087,986 | $16,887,871 |
| 2019 | $362,509 | $18,413,024 | $2,026,056 | $16,386,968 |
| 2018 | $127,883 | $5,976,380 | $490,771 | $5,485,609 |
| 2016 | $121,476 | $5,744,313 | $471,715 | $5,272,598 |
| 2015 | $119,357 | $5,658,029 | $464,630 | $5,193,399 |
| 2014 | $117,756 | $5,547,197 | $455,529 | $5,091,668 |
Source: Public Records
Map
Nearby Homes
- 2247 Kaydel Rd
- 2258 Kaydel Rd
- 11264 Linard St
- 1528 Durfee Ave
- 1312 Penn Mar Ave
- 11073 Andrews St
- 11244 Broadmead St
- 11249 Broadmead St
- 11436 Herb St
- 11408 Herb St Unit 2
- 10907 Danielson Dr
- 1227 Esteban Torres Dr
- 10839 Skyline Dr
- 13010 Camino Del Rey
- 1236 Kruse Dr
- 1847 Whittier Woods Dr
- 1859 Via Bandera
- 2601 Durfee Ave Unit B
- 2601 Durfee Ave Unit D
- 2601 Durfee Ave Unit C