2418 Salem Glen Xing Lot 68 Murfreesboro, TN 37128
Estimated Value: $375,000 - $433,000
3
Beds
3
Baths
1,589
Sq Ft
$252/Sq Ft
Est. Value
About This Home
This home is located at 2418 Salem Glen Xing Lot 68, Murfreesboro, TN 37128 and is currently estimated at $400,585, approximately $252 per square foot. 2418 Salem Glen Xing Lot 68 is a home located in Rutherford County with nearby schools including Scales Elementary School, Rockvale Middle School, and Rockvale High School.
Ownership History
Date
Name
Owned For
Owner Type
Purchase Details
Closed on
Mar 18, 2021
Sold by
Ibrahim Ashraf and Ibrahim Nancy Safwat
Bought by
Ah4r Tn Properties Two Llc
Current Estimated Value
Purchase Details
Closed on
May 21, 2020
Sold by
Property Owner 10 Llc
Bought by
Progress Residential Borrower 14 Llc
Purchase Details
Closed on
Jun 29, 2019
Sold by
Herrejon Alfredo Carrillo and Landeros Paola Munoz
Bought by
Property Owner 10 Llc
Purchase Details
Closed on
Dec 23, 2015
Sold by
Ole South Properties Inc
Bought by
Herrejon Alfredo Carrillo and Landeros Paola Munoz
Home Financials for this Owner
Home Financials are based on the most recent Mortgage that was taken out on this home.
Original Mortgage
$193,471
Interest Rate
3.97%
Mortgage Type
FHA
Purchase Details
Closed on
May 21, 2015
Sold by
Decker & Belt Co Llc
Bought by
Ole South Properties Inc
Create a Home Valuation Report for This Property
The Home Valuation Report is an in-depth analysis detailing your home's value as well as a comparison with similar homes in the area
Home Values in the Area
Average Home Value in this Area
Purchase History
| Date | Buyer | Sale Price | Title Company |
|---|---|---|---|
| Ah4r Tn Properties Two Llc | $329,000 | Stewart Title Company Tn Div | |
| Progress Residential Borrower 14 Llc | -- | Os National Llc | |
| Property Owner 10 Llc | $244,900 | Realty Title & Escrow | |
| Herrejon Alfredo Carrillo | $197,041 | -- | |
| Ole South Properties Inc | $189,000 | -- | |
| Decker & Belt Co | -- | -- |
Source: Public Records
Mortgage History
| Date | Status | Borrower | Loan Amount |
|---|---|---|---|
| Previous Owner | Herrejon Alfredo Carrillo | $193,471 |
Source: Public Records
Tax History Compared to Growth
Tax History
| Year | Tax Paid | Tax Assessment Tax Assessment Total Assessment is a certain percentage of the fair market value that is determined by local assessors to be the total taxable value of land and additions on the property. | Land | Improvement |
|---|---|---|---|---|
| 2025 | $2,128 | $75,225 | $13,750 | $61,475 |
| 2024 | $2,128 | $75,225 | $13,750 | $61,475 |
| 2023 | $1,411 | $75,225 | $13,750 | $61,475 |
| 2022 | $1,216 | $75,225 | $13,750 | $61,475 |
| 2021 | $1,180 | $53,175 | $9,375 | $43,800 |
| 2020 | $1,180 | $53,175 | $9,375 | $43,800 |
| 2019 | $1,180 | $53,175 | $9,375 | $43,800 |
Source: Public Records
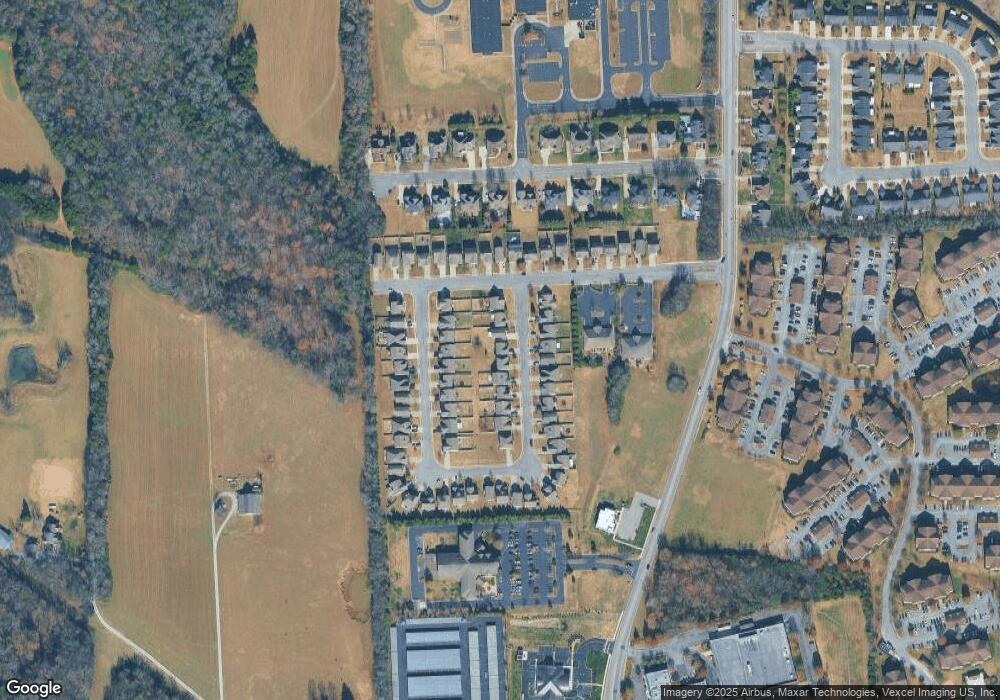
Map
Nearby Homes
- 3429 Deerview Dr
- 3409 Nightshade Dr
- 3525 Nightshade Dr
- 2927 Stuyvesant Ln
- 1814 Oak Dr
- 1904 Oak Dr
- 1920 Oak Dr
- 1924 Oak Dr
- 2044 Alysheba Run
- 2040 Alysheba Run
- 2339 Shafer Dr
- 1315 Elevation ABC Plan at Evergreen Farms
- 3508 Donerail Cir
- 2818 Silver Springs Ct
- 2819 Silver Springs Ct
- 1944 Colyn Ave
- 3217 Mapleside Ln
- 1005 Harwell Ln
- 3838 Faithway Dr
- 1366 Amboress Ln
- 2418 Salem Glen Crossing
- 2414 Salem Glen Xing Lot 69
- 2414 Salem Glen Crossing
- 2410 Salem Glen Crossing Lot 19
- 2410 Salem Glen Crossing
- 2642 Salem Glen Crossing
- 2642 Salem Glen Xing Lot 55
- 2430 Salem Glen Xing Lot 65
- 2430 Salem Glen Crossing
- 2646 Salem Glen Crossing
- 2646 Salem Glen Xing Lot 54
- 2638 Salem Glen Crossing
- 2638 Salem Glen Crossing Lot 56
- 2406 Salem Glen Crossing
- 2650 Salem Glen Crossing
- 2634 Salem Glen Crossing
- 2634 Salem Glen Xing Lot 57
- 2413 Salem Glen Crossing
- 2417 Salem Glen Crossing Lot 23
- 2417 Salem Glen Crossing