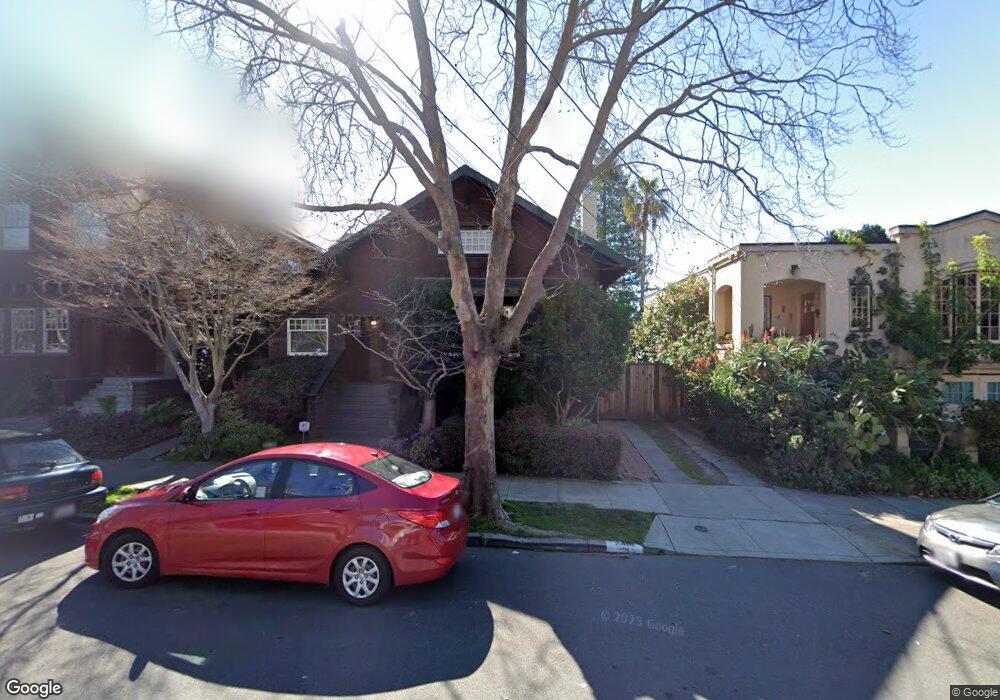
2418 Woolsey St Berkeley, CA 94705
Elmwood NeighborhoodEstimated Value: $1,362,161 - $1,868,000
3
Beds
3
Baths
2,047
Sq Ft
$833/Sq Ft
Est. Value
About This Home
This home is located at 2418 Woolsey St, Berkeley, CA 94705 and is currently estimated at $1,704,290, approximately $832 per square foot. 2418 Woolsey St is a home located in Alameda County with nearby schools including Peralta Elementary School, Claremont Middle School, and Oakland Technical High School.
Ownership History
Date
Name
Owned For
Owner Type
Purchase Details
Closed on
Jul 7, 1999
Sold by
Backman K Michael and Swayne Steven R
Bought by
Siegel Daniel B and Siegel Traci L
Current Estimated Value
Home Financials for this Owner
Home Financials are based on the most recent Mortgage that was taken out on this home.
Original Mortgage
$428,800
Outstanding Balance
$119,542
Interest Rate
7.5%
Estimated Equity
$1,584,748
Purchase Details
Closed on
May 2, 1994
Sold by
Corner Michael W and Corner Elizabeth A
Bought by
Backman K Michael and Swayne Steven R
Home Financials for this Owner
Home Financials are based on the most recent Mortgage that was taken out on this home.
Original Mortgage
$276,800
Interest Rate
4%
Create a Home Valuation Report for This Property
The Home Valuation Report is an in-depth analysis detailing your home's value as well as a comparison with similar homes in the area
Home Values in the Area
Average Home Value in this Area
Purchase History
| Date | Buyer | Sale Price | Title Company |
|---|---|---|---|
| Siegel Daniel B | $536,000 | Old Republic Title Company | |
| Backman K Michael | $346,000 | Fidelity National Title |
Source: Public Records
Mortgage History
| Date | Status | Borrower | Loan Amount |
|---|---|---|---|
| Open | Siegel Daniel B | $428,800 | |
| Previous Owner | Backman K Michael | $276,800 | |
| Closed | Backman K Michael | $23,000 |
Source: Public Records
Tax History
| Year | Tax Paid | Tax Assessment Tax Assessment Total Assessment is a certain percentage of the fair market value that is determined by local assessors to be the total taxable value of land and additions on the property. | Land | Improvement |
|---|---|---|---|---|
| 2025 | $10,500 | $712,879 | $143,238 | $576,641 |
| 2024 | $10,500 | $698,766 | $140,430 | $565,336 |
| 2023 | $11,047 | $691,928 | $137,676 | $554,252 |
| 2022 | $10,783 | $671,364 | $134,977 | $543,387 |
| 2021 | $10,368 | $658,066 | $132,331 | $532,735 |
| 2020 | $10,281 | $658,251 | $130,975 | $527,276 |
| 2019 | $9,933 | $645,347 | $128,408 | $516,939 |
| 2018 | $9,727 | $632,695 | $125,890 | $506,805 |
| 2017 | $9,373 | $620,291 | $123,422 | $496,869 |
| 2016 | $9,079 | $608,132 | $121,003 | $487,129 |
| 2015 | $9,033 | $598,999 | $119,186 | $479,813 |
| 2014 | $9,168 | $587,265 | $116,851 | $470,414 |
Source: Public Records
Map
Nearby Homes
- 6446 Colby St
- 2477 Prince St
- 360 Alcatraz Ave
- 2935 Florence St
- 3046 Deakin St
- 2917 Telegraph Ave
- 2243 Ashby Ave
- 556 Alcatraz Ave
- 629 66th St
- 2124 Prince St
- 2923 Wheeler St
- 2962 Piedmont Ave
- 2110 Ashby Ave
- 667 & 667A Alcatraz Ave
- 667 Alcatraz Ave
- 6555 Shattuck Ave
- 6320 Shattuck Ave
- 6300 Shattuck Ave Unit 1
- 2643 Stuart St
- 2057 Emerson St
Your Personal Tour Guide
Ask me questions while you tour the home.