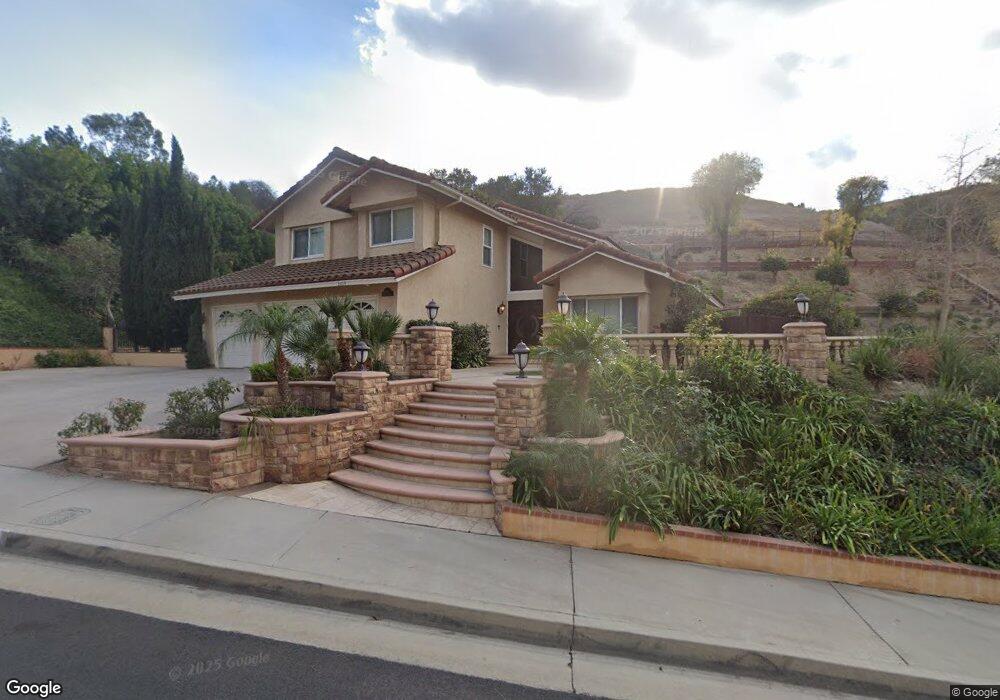
2419 Saleroso Dr Rowland Heights, CA 91748
Estimated Value: $1,144,496 - $1,354,000
4
Beds
3
Baths
2,535
Sq Ft
$497/Sq Ft
Est. Value
About This Home
This home is located at 2419 Saleroso Dr, Rowland Heights, CA 91748 and is currently estimated at $1,259,624, approximately $496 per square foot. 2419 Saleroso Dr is a home located in Los Angeles County with nearby schools including Alvarado Intermediate School, John A. Rowland High School, and Southlands Christian Schools.
Ownership History
Date
Name
Owned For
Owner Type
Purchase Details
Closed on
Mar 19, 2018
Sold by
Wang Wei
Bought by
Wang Wei and Wei Wang Family Trust
Current Estimated Value
Purchase Details
Closed on
Feb 10, 2017
Sold by
Ng Jui M
Bought by
Wang Wei Vivian
Purchase Details
Closed on
Jan 20, 1999
Sold by
Jui Mun Ng
Bought by
Ng Jui Mun
Purchase Details
Closed on
Oct 27, 1998
Sold by
Wang Wei
Bought by
Ng Jui Mun
Home Financials for this Owner
Home Financials are based on the most recent Mortgage that was taken out on this home.
Original Mortgage
$227,000
Interest Rate
6.69%
Purchase Details
Closed on
Oct 23, 1998
Sold by
Shung Pin Yuan and Shung Wan Fen Chow
Bought by
Ng Jui Mun
Home Financials for this Owner
Home Financials are based on the most recent Mortgage that was taken out on this home.
Original Mortgage
$227,000
Interest Rate
6.69%
Purchase Details
Closed on
Mar 30, 1994
Sold by
Serrano Reconveyance Company
Bought by
Emc Mtg Corp
Create a Home Valuation Report for This Property
The Home Valuation Report is an in-depth analysis detailing your home's value as well as a comparison with similar homes in the area
Home Values in the Area
Average Home Value in this Area
Purchase History
| Date | Buyer | Sale Price | Title Company |
|---|---|---|---|
| Wang Wei | -- | None Available | |
| Wang Wei Vivian | -- | None Available | |
| Ng Jui Mun | -- | -- | |
| Ng Jui Mun | -- | Chicago Title | |
| Ng Jui Mun | $291,000 | Chicago Title | |
| Emc Mtg Corp | $211,500 | Investors Title |
Source: Public Records
Mortgage History
| Date | Status | Borrower | Loan Amount |
|---|---|---|---|
| Previous Owner | Ng Jui Mun | $227,000 |
Source: Public Records
Tax History Compared to Growth
Tax History
| Year | Tax Paid | Tax Assessment Tax Assessment Total Assessment is a certain percentage of the fair market value that is determined by local assessors to be the total taxable value of land and additions on the property. | Land | Improvement |
|---|---|---|---|---|
| 2025 | $6,117 | $456,178 | $177,295 | $278,883 |
| 2024 | $6,117 | $447,234 | $173,819 | $273,415 |
| 2023 | $5,872 | $438,465 | $170,411 | $268,054 |
| 2022 | $5,614 | $429,869 | $167,070 | $262,799 |
| 2021 | $5,512 | $421,442 | $163,795 | $257,647 |
| 2019 | $5,347 | $408,944 | $158,938 | $250,006 |
| 2018 | $5,106 | $400,926 | $155,822 | $245,104 |
| 2016 | $4,895 | $385,360 | $149,772 | $235,588 |
| 2015 | $4,816 | $379,573 | $147,523 | $232,050 |
| 2014 | $4,810 | $372,139 | $144,634 | $227,505 |
Source: Public Records
Map
Nearby Homes
- 17712 Nearbank Dr
- 2503 Donosa Dr
- 2330 Donosa Dr
- 2048 Calle Bogota
- 1948 Calle Bogota
- 17834 Calle Los Arboles
- 18220 Gallineta St
- 18239 Villa Clara St
- 17070 Colima Rd Unit 284
- 0 Airoso Rd
- 18109 Graystone Way
- 2426 Batson Ave
- 2521 Mountainview Ct
- 16978 Colchester Way Unit 140
- 18131 Camino Bello Unit 4
- 18138 Via Amorosa Unit 4
- 2367 Mountain Brook Dr
- 18225 Camino Bello Unit 4
- 2474 Patrician View Ave
- 2240 Valle Dr
- 2405 Saleroso Dr
- 2433 Saleroso Dr
- 2515 Cap Ct
- 2355 Saleroso Dr
- 2503 Saleroso Dr
- 2388 Remora Dr
- 2509 Cap Ct
- 2378 Remora Dr
- 2349 Saleroso Dr
- 2515 Saleroso Dr
- 2516 Saleroso Dr
- 2383 Remora Dr
- 2525 Saleroso Dr
- 2341 Saleroso Dr
- 2374 Remora Dr
- 2503 Cap Ct
- 2508 Cap Ct
- 2508 Saleroso Dr
- 2419 Fallen Dr
- 2371 Remora Dr