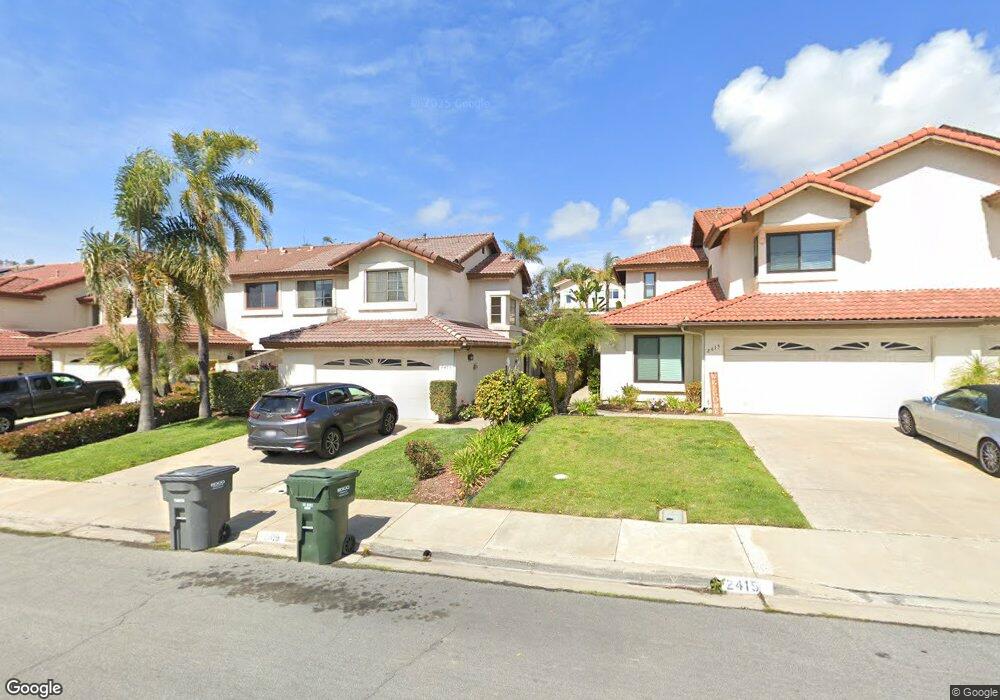
2419 Summerhill Dr Encinitas, CA 92024
Central Encinitas NeighborhoodEstimated Value: $1,310,000 - $1,400,000
3
Beds
3
Baths
1,745
Sq Ft
$775/Sq Ft
Est. Value
About This Home
This home is located at 2419 Summerhill Dr, Encinitas, CA 92024 and is currently estimated at $1,351,773, approximately $774 per square foot. 2419 Summerhill Dr is a home located in San Diego County with nearby schools including Flora Vista Elementary, Diegueno Middle School, and La Costa Canyon High School.
Ownership History
Date
Name
Owned For
Owner Type
Purchase Details
Closed on
Dec 30, 2020
Sold by
Chang Helena
Bought by
Chang Robert and The Robert Chang Real Property
Current Estimated Value
Purchase Details
Closed on
Jul 1, 2016
Sold by
Chang Helena
Bought by
Chang Helena
Purchase Details
Closed on
Dec 22, 2003
Sold by
Chang John and Chang Helena
Bought by
Chang John and Chang Helena
Home Financials for this Owner
Home Financials are based on the most recent Mortgage that was taken out on this home.
Original Mortgage
$56,380
Interest Rate
4.87%
Mortgage Type
Purchase Money Mortgage
Purchase Details
Closed on
Aug 17, 1994
Sold by
Chang John and Chang Helena
Bought by
Chang John and Chang Helena
Purchase Details
Closed on
Aug 26, 1985
Create a Home Valuation Report for This Property
The Home Valuation Report is an in-depth analysis detailing your home's value as well as a comparison with similar homes in the area
Home Values in the Area
Average Home Value in this Area
Purchase History
| Date | Buyer | Sale Price | Title Company |
|---|---|---|---|
| Chang Robert | -- | None Available | |
| Chang Helena | -- | None Available | |
| Chang Helena | -- | None Available | |
| Chang John | -- | Land America | |
| Chang John | -- | Land America | |
| Chang John | -- | -- | |
| -- | $117,000 | -- |
Source: Public Records
Mortgage History
| Date | Status | Borrower | Loan Amount |
|---|---|---|---|
| Previous Owner | Chang John | $56,380 |
Source: Public Records
Tax History Compared to Growth
Tax History
| Year | Tax Paid | Tax Assessment Tax Assessment Total Assessment is a certain percentage of the fair market value that is determined by local assessors to be the total taxable value of land and additions on the property. | Land | Improvement |
|---|---|---|---|---|
| 2025 | $3,057 | $232,928 | $64,153 | $168,775 |
| 2024 | $3,057 | $228,362 | $62,896 | $165,466 |
| 2023 | $2,939 | $223,885 | $61,663 | $162,222 |
| 2022 | $2,848 | $219,496 | $60,454 | $159,042 |
| 2021 | $2,779 | $215,193 | $59,269 | $155,924 |
| 2020 | $2,716 | $212,988 | $58,662 | $154,326 |
| 2019 | $2,668 | $208,812 | $57,512 | $151,300 |
| 2018 | $2,635 | $204,719 | $56,385 | $148,334 |
| 2017 | $2,594 | $200,706 | $55,280 | $145,426 |
| 2016 | $2,524 | $196,772 | $54,197 | $142,575 |
| 2015 | $2,463 | $193,817 | $53,383 | $140,434 |
| 2014 | $2,392 | $190,022 | $52,338 | $137,684 |
Source: Public Records
Map
Nearby Homes
- 721 Summersong Ln
- 1278 Avenida Miguel
- 1633 Willowspring Dr N
- 1931 Avenida Joaquin
- 1931 Hummock Ln
- 1981 Avenida Joaquin
- 1655 Splitrail Dr
- 1848 Wandering Rd
- 3736 38 Via Rancho Michelle
- 658 660 Santa fe Dr
- 772 Conestoga Ct
- 8008 Avenida Secreto
- 3243 Avenida Aragon
- 1709 Edgefield Ln
- 1785 Caliban Dr
- 1617 Blossom Field Way
- 1519 Valleda Ln
- 2702 Jacaranda Ave
- 2128 Mountain Vista Dr
- 1838 Stonebrook Ln
- 2421 Summerhill Dr
- 2415 Summerhill Dr
- 2425 Summerhill Dr
- 2413 Summerhill Dr
- 2427 Summerhill Dr
- 2409 Summerhill Dr
- 1831 Avenida Mimosa
- 2431 Summerhill Dr
- 2420 Summerhill Dr
- 1837 Avenida Mimosa
- 1825 Avenida Mimosa
- 2407 Summerhill Dr
- 2416 Summerhill Dr
- 2422 Summerhill Dr
- 2414 Summerhill Dr
- 1843 Avenida Mimosa
- 1819 Avenida Mimosa
- 2403 Summerhill Dr
- 2410 Summerhill Dr
- 2244 Village Center Dr