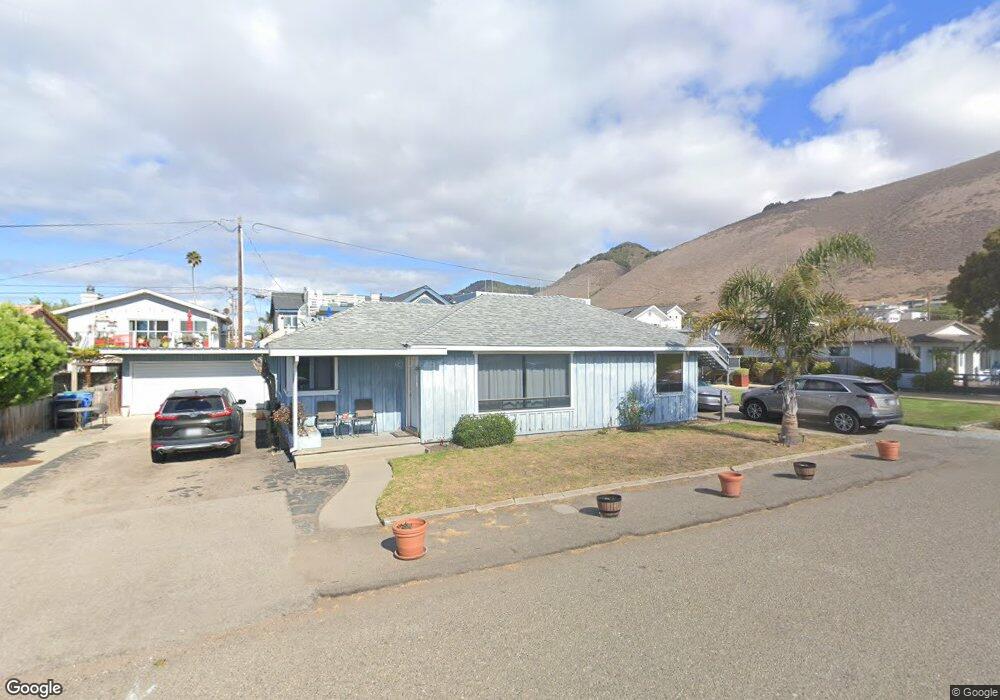
242 Cliff Ave Pismo Beach, CA 93449
Estimated Value: $1,249,000 - $1,648,000
3
Beds
2
Baths
1,122
Sq Ft
$1,240/Sq Ft
Est. Value
About This Home
This home is located at 242 Cliff Ave, Pismo Beach, CA 93449 and is currently estimated at $1,390,803, approximately $1,239 per square foot. 242 Cliff Ave is a home located in San Luis Obispo County with nearby schools including Judkins Middle School, Arroyo Grande High School, and Coastal Christian School.
Ownership History
Date
Name
Owned For
Owner Type
Purchase Details
Closed on
Apr 6, 2022
Sold by
Ryan Bruce E
Bought by
Kunz Kathleen M
Current Estimated Value
Home Financials for this Owner
Home Financials are based on the most recent Mortgage that was taken out on this home.
Original Mortgage
$800,000
Outstanding Balance
$754,694
Interest Rate
4.67%
Mortgage Type
New Conventional
Estimated Equity
$636,109
Purchase Details
Closed on
Feb 27, 1998
Sold by
Ryan Bruce E and Kunz Kathleen M
Bought by
Ryan Bruce E and Kunz Kathleen M
Home Financials for this Owner
Home Financials are based on the most recent Mortgage that was taken out on this home.
Original Mortgage
$205,500
Interest Rate
7.05%
Purchase Details
Closed on
Jul 24, 1994
Sold by
Carlson Richard Henry and Carlson Carol Jean
Bought by
Ryan Bruce E and Kunz Ryan Kathleen M
Home Financials for this Owner
Home Financials are based on the most recent Mortgage that was taken out on this home.
Original Mortgage
$220,000
Interest Rate
8.38%
Create a Home Valuation Report for This Property
The Home Valuation Report is an in-depth analysis detailing your home's value as well as a comparison with similar homes in the area
Home Values in the Area
Average Home Value in this Area
Purchase History
| Date | Buyer | Sale Price | Title Company |
|---|---|---|---|
| Kunz Kathleen M | $816,000 | Fidelity National Title | |
| Ryan Bruce E | -- | Chicago Title Co | |
| Ryan Bruce E | $275,000 | Ticor Title Insurance Compan |
Source: Public Records
Mortgage History
| Date | Status | Borrower | Loan Amount |
|---|---|---|---|
| Open | Kunz Kathleen M | $800,000 | |
| Previous Owner | Ryan Bruce E | $205,500 | |
| Previous Owner | Ryan Bruce E | $220,000 | |
| Closed | Ryan Bruce E | $41,250 |
Source: Public Records
Tax History
| Year | Tax Paid | Tax Assessment Tax Assessment Total Assessment is a certain percentage of the fair market value that is determined by local assessors to be the total taxable value of land and additions on the property. | Land | Improvement |
|---|---|---|---|---|
| 2025 | $11,503 | $1,096,889 | $919,208 | $177,681 |
| 2024 | $11,365 | $1,075,383 | $901,185 | $174,198 |
| 2023 | $11,365 | $1,054,298 | $883,515 | $170,783 |
| 2022 | $4,793 | $435,239 | $332,371 | $102,868 |
| 2021 | $4,777 | $426,705 | $325,854 | $100,851 |
| 2020 | $4,719 | $422,330 | $322,513 | $99,817 |
| 2019 | $4,681 | $414,050 | $316,190 | $97,860 |
| 2018 | $4,621 | $405,933 | $309,991 | $95,942 |
| 2017 | $4,541 | $397,974 | $303,913 | $94,061 |
| 2016 | $4,294 | $390,171 | $297,954 | $92,217 |
| 2015 | $4,234 | $384,311 | $293,479 | $90,832 |
| 2014 | $4,083 | $376,784 | $287,731 | $89,053 |
Source: Public Records
Map
Nearby Homes
- 229 Pier Ave
- 244 Windward Ave
- 215 Placentia Ave
- 214 Placentia Ave
- 150 Castaic Ave
- 120 Esparto Ave
- 328 Esparto Ave
- 140 99 S Dolliver Unit 99
- 234 Vista Del Mar Ave
- 2101 Shoreline Dr
- 2100 Costa Del Sol
- 129 Park Place
- 125 Park Place
- 106 Calle Corea
- 2732 Barcelona
- 2738 Barcelona
- 2733 Barcelona
- 2734 Barcelona
- 2736 Barcelona
- 2570 Spyglass Dr
- 266 Cliff Ave
- 218 Cliff Ave
- 229 Seaview Ave
- 231 Seaview Ave
- 219 Seaview Ave
- 280 Cliff Ave
- 212 Cliff Ave
- 277 Seaview Ave
- 217 Seaview Ave
- 200 Cliff Ave
- 205 Seaview Ave
- 289 Seaview Ave
- 224 Seaview Ave
- 254 Seaview Ave
- 218 Seaview Ave
- 100 Cliff Ave
- 1 Cliff Ave
- 266 Seaview Ave
- 278 Seaview Ave
- 206 Seaview Ave
Your Personal Tour Guide
Ask me questions while you tour the home.