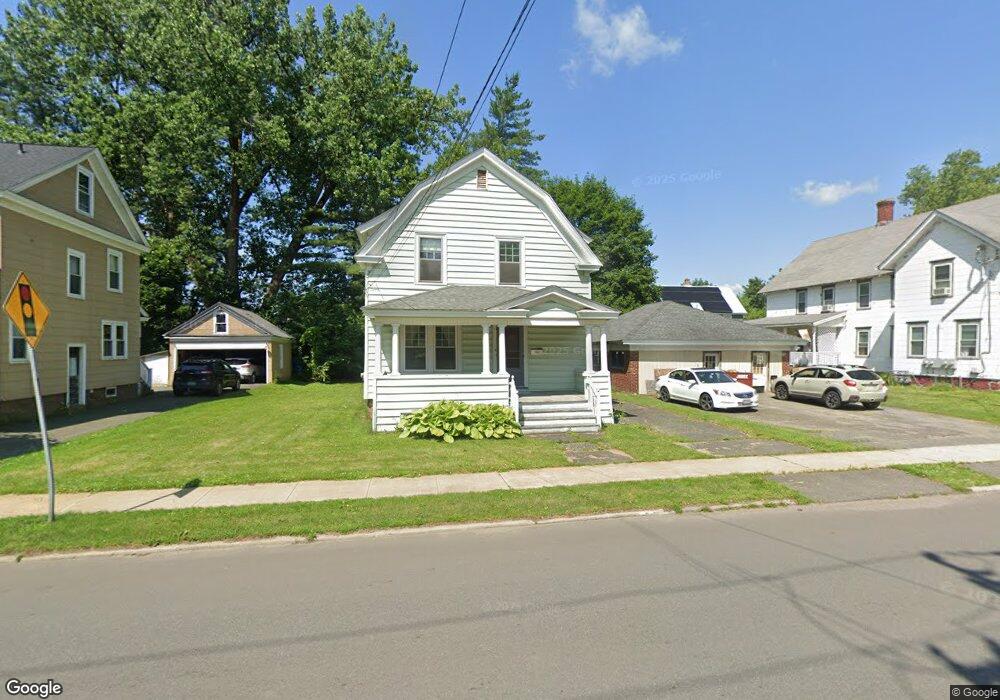
242 Conway St Greenfield, MA 01301
Estimated Value: $256,000 - $314,000
3
Beds
1
Bath
1,152
Sq Ft
$247/Sq Ft
Est. Value
About This Home
This home is located at 242 Conway St, Greenfield, MA 01301 and is currently estimated at $284,181, approximately $246 per square foot. 242 Conway St is a home located in Franklin County with nearby schools including Cornerstone Christian School and Holy Trinity School.
Ownership History
Date
Name
Owned For
Owner Type
Purchase Details
Closed on
May 10, 2005
Sold by
Gruber Gary D
Bought by
Brush Cynthia L and Loring Paul R
Current Estimated Value
Purchase Details
Closed on
Sep 17, 2004
Sold by
Glovacki James J and Glowacki James J
Bought by
Brush Cynthia L and Loring Paul R
Purchase Details
Closed on
May 18, 1988
Sold by
Hartwell Max M
Bought by
Hoch Susanae F
Home Financials for this Owner
Home Financials are based on the most recent Mortgage that was taken out on this home.
Original Mortgage
$68,000
Interest Rate
10.13%
Mortgage Type
Purchase Money Mortgage
Create a Home Valuation Report for This Property
The Home Valuation Report is an in-depth analysis detailing your home's value as well as a comparison with similar homes in the area
Home Values in the Area
Average Home Value in this Area
Purchase History
| Date | Buyer | Sale Price | Title Company |
|---|---|---|---|
| Brush Cynthia L | -- | -- | |
| Brush Cynthia L | -- | -- | |
| Gruber Gary D | -- | -- | |
| Brush Cynthia L | $130,000 | -- | |
| Brush Cynthia L | $130,000 | -- | |
| Hoch Susanae F | $85,000 | -- |
Source: Public Records
Mortgage History
| Date | Status | Borrower | Loan Amount |
|---|---|---|---|
| Previous Owner | Hoch Susanae F | $68,000 |
Source: Public Records
Tax History Compared to Growth
Tax History
| Year | Tax Paid | Tax Assessment Tax Assessment Total Assessment is a certain percentage of the fair market value that is determined by local assessors to be the total taxable value of land and additions on the property. | Land | Improvement |
|---|---|---|---|---|
| 2025 | $3,499 | $178,900 | $45,900 | $133,000 |
| 2024 | $3,546 | $173,900 | $41,900 | $132,000 |
| 2023 | $3,199 | $162,800 | $41,900 | $120,900 |
| 2022 | $3,120 | $139,800 | $39,900 | $99,900 |
| 2021 | $3,074 | $132,400 | $42,900 | $89,500 |
| 2020 | $2,866 | $125,000 | $38,900 | $86,100 |
| 2019 | $2,683 | $120,000 | $33,900 | $86,100 |
| 2018 | $2,638 | $117,600 | $33,300 | $84,300 |
| 2017 | $2,555 | $117,600 | $33,300 | $84,300 |
| 2016 | $2,410 | $110,500 | $28,900 | $81,600 |
| 2015 | $2,395 | $106,400 | $29,300 | $77,100 |
| 2014 | $2,186 | $106,500 | $29,300 | $77,200 |
Source: Public Records
Map
Nearby Homes