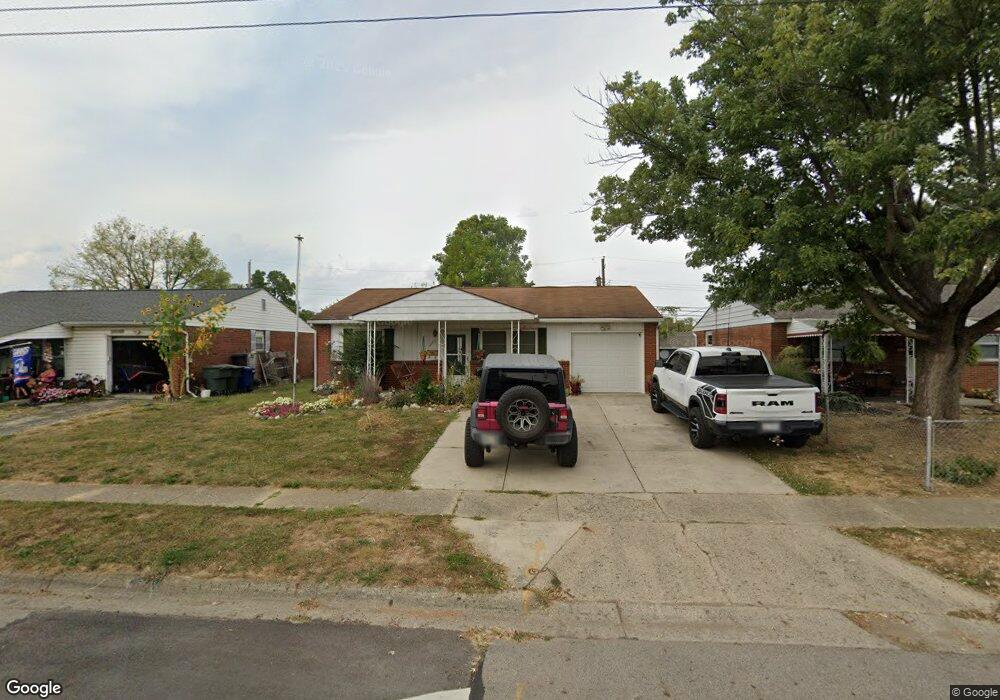
242 Cullman Rd Columbus, OH 43207
Obetz-Lockbourne NeighborhoodEstimated Value: $164,172 - $187,000
3
Beds
1
Bath
1,040
Sq Ft
$170/Sq Ft
Est. Value
About This Home
This home is located at 242 Cullman Rd, Columbus, OH 43207 and is currently estimated at $176,293, approximately $169 per square foot. 242 Cullman Rd is a home located in Franklin County with nearby schools including Parsons Elementary School, Buckeye Middle School, and Marion-Franklin High School.
Ownership History
Date
Name
Owned For
Owner Type
Purchase Details
Closed on
Oct 27, 2003
Sold by
Lucas Sherry Elaine
Bought by
Hill Matthew Thomas
Current Estimated Value
Home Financials for this Owner
Home Financials are based on the most recent Mortgage that was taken out on this home.
Original Mortgage
$77,647
Outstanding Balance
$35,093
Interest Rate
6.1%
Mortgage Type
FHA
Estimated Equity
$141,200
Purchase Details
Closed on
May 23, 1997
Sold by
Smith James Larry and Smith Linda
Bought by
Hill Matthew Thomas and Lucas Sherry Elaine
Purchase Details
Closed on
Mar 3, 1995
Sold by
Sihock Keomany
Bought by
James Larry Smith
Home Financials for this Owner
Home Financials are based on the most recent Mortgage that was taken out on this home.
Original Mortgage
$55,250
Interest Rate
9.12%
Mortgage Type
New Conventional
Purchase Details
Closed on
Aug 1, 1983
Create a Home Valuation Report for This Property
The Home Valuation Report is an in-depth analysis detailing your home's value as well as a comparison with similar homes in the area
Home Values in the Area
Average Home Value in this Area
Purchase History
| Date | Buyer | Sale Price | Title Company |
|---|---|---|---|
| Hill Matthew Thomas | -- | -- | |
| Hill Matthew Thomas | $66,500 | -- | |
| James Larry Smith | $58,900 | -- | |
| -- | $44,000 | -- |
Source: Public Records
Mortgage History
| Date | Status | Borrower | Loan Amount |
|---|---|---|---|
| Open | Hill Matthew Thomas | $77,647 | |
| Previous Owner | James Larry Smith | $55,250 |
Source: Public Records
Tax History
| Year | Tax Paid | Tax Assessment Tax Assessment Total Assessment is a certain percentage of the fair market value that is determined by local assessors to be the total taxable value of land and additions on the property. | Land | Improvement |
|---|---|---|---|---|
| 2025 | $2,160 | $48,130 | $15,440 | $32,690 |
| 2024 | $2,160 | $48,130 | $15,440 | $32,690 |
| 2023 | $2,132 | $48,125 | $15,435 | $32,690 |
| 2022 | $1,414 | $27,270 | $8,860 | $18,410 |
| 2021 | $1,417 | $27,270 | $8,860 | $18,410 |
| 2020 | $1,419 | $27,270 | $8,860 | $18,410 |
| 2019 | $1,448 | $23,870 | $7,700 | $16,170 |
| 2018 | $723 | $23,870 | $7,700 | $16,170 |
| 2017 | $1,645 | $23,870 | $7,700 | $16,170 |
| 2016 | $1,844 | $27,830 | $6,020 | $21,810 |
| 2015 | $837 | $27,830 | $6,020 | $21,810 |
| 2014 | $1,678 | $27,830 | $6,020 | $21,810 |
| 2013 | $871 | $29,295 | $6,335 | $22,960 |
Source: Public Records
Map
Nearby Homes
- 2724 S High St
- 211 Delaney Dr
- 228 Currier Dr
- 19 E Castle Rd
- 238 Delray Rd
- 3127 Parsons Ave
- 2808 Dolby Dr
- 84 Betz Rd
- 253 Benfield Ave
- 460 Coulter Ave
- 115 W Castle Rd
- 3204 Lee Ellen Place
- 2382 S 6th St
- 162 Phelps Rd
- 1633-1635 E Greenway Ave
- 3234 E Ave
- 445 Basswood Rd
- 3325 Parsons Ave
- 256 Rumsey Rd Unit 258
- 611 Lock Ave
- 236 Cullman Rd
- 250 Cullman Rd
- 256 Cullman Rd
- 228 Cullman Rd
- 245 E Alcott Rd
- 239 E Alcott Rd
- 253 E Alcott Rd
- 264 Cullman Rd
- 233 E Alcott Rd
- 222 Cullman Rd
- 259 E Alcott Rd
- 243 Cullman Rd
- 235 Cullman Rd
- 249 Cullman Rd
- 225 E Alcott Rd
- 229 Cullman Rd
- 257 Cullman Rd
- 267 E Alcott Rd
- 214 Cullman Rd
- 270 Cullman Rd
Your Personal Tour Guide
Ask me questions while you tour the home.