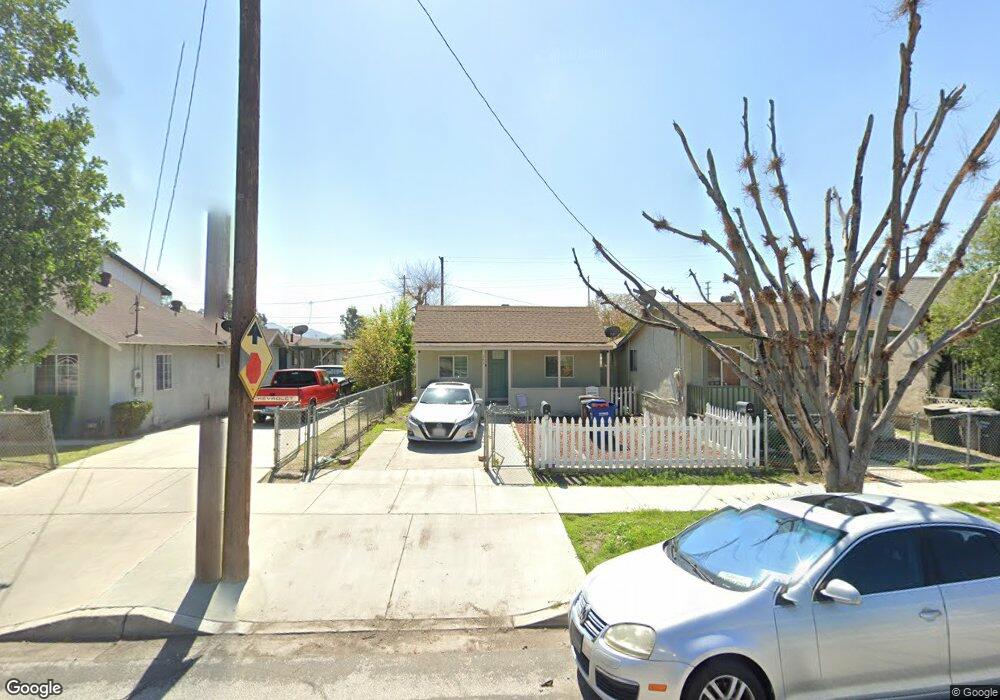
242 E L St Colton, CA 92324
Estimated Value: $379,025 - $473,000
2
Beds
1
Bath
720
Sq Ft
$615/Sq Ft
Est. Value
About This Home
This home is located at 242 E L St, Colton, CA 92324 and is currently estimated at $442,756, approximately $614 per square foot. 242 E L St is a home located in San Bernardino County with nearby schools including Woodrow Wilson Elementary School, Terrace Hills Middle School, and Grand Terrace High School.
Ownership History
Date
Name
Owned For
Owner Type
Purchase Details
Closed on
Sep 21, 2004
Sold by
Okorafor Vincent
Bought by
Vega Joe I and Vega Antoinette F
Current Estimated Value
Home Financials for this Owner
Home Financials are based on the most recent Mortgage that was taken out on this home.
Original Mortgage
$100,000
Interest Rate
5.65%
Mortgage Type
Purchase Money Mortgage
Purchase Details
Closed on
Feb 16, 2001
Sold by
Countrywide Home Loans
Bought by
Hud
Purchase Details
Closed on
Mar 9, 1996
Sold by
Barrio Florentino
Bought by
New Haven Corp
Purchase Details
Closed on
Oct 6, 1993
Sold by
Zuniga Hector M
Bought by
Barrio Florentino
Home Financials for this Owner
Home Financials are based on the most recent Mortgage that was taken out on this home.
Original Mortgage
$128,441
Interest Rate
6.95%
Mortgage Type
FHA
Create a Home Valuation Report for This Property
The Home Valuation Report is an in-depth analysis detailing your home's value as well as a comparison with similar homes in the area
Home Values in the Area
Average Home Value in this Area
Purchase History
| Date | Buyer | Sale Price | Title Company |
|---|---|---|---|
| Vega Joe I | $125,000 | North American Title Co | |
| Hud | -- | Landsafe Title | |
| New Haven Corp | -- | -- | |
| Barrio Florentino | -- | World Title Co |
Source: Public Records
Mortgage History
| Date | Status | Borrower | Loan Amount |
|---|---|---|---|
| Previous Owner | Vega Joe I | $100,000 | |
| Previous Owner | Barrio Florentino | $128,441 | |
| Closed | Vega Joe I | $25,000 |
Source: Public Records
Tax History
| Year | Tax Paid | Tax Assessment Tax Assessment Total Assessment is a certain percentage of the fair market value that is determined by local assessors to be the total taxable value of land and additions on the property. | Land | Improvement |
|---|---|---|---|---|
| 2025 | $2,191 | $174,239 | $27,878 | $146,361 |
| 2024 | $2,090 | $170,822 | $27,331 | $143,491 |
| 2023 | $2,096 | $167,472 | $26,795 | $140,677 |
| 2022 | $2,067 | $164,189 | $26,270 | $137,919 |
| 2021 | $2,109 | $160,970 | $25,755 | $135,215 |
| 2020 | $2,118 | $159,320 | $25,491 | $133,829 |
| 2019 | $2,061 | $156,196 | $24,991 | $131,205 |
| 2018 | $1,355 | $101,600 | $29,900 | $71,700 |
| 2017 | $1,291 | $98,200 | $28,900 | $69,300 |
| 2016 | $1,263 | $91,800 | $27,000 | $64,800 |
| 2015 | $1,151 | $85,000 | $25,000 | $60,000 |
| 2014 | $777 | $57,500 | $18,400 | $39,100 |
Source: Public Records
Map
Nearby Homes
Your Personal Tour Guide
Ask me questions while you tour the home.