Estimated Value: $416,000 - $721,000
3
Beds
1
Bath
1,232
Sq Ft
$430/Sq Ft
Est. Value
About This Home
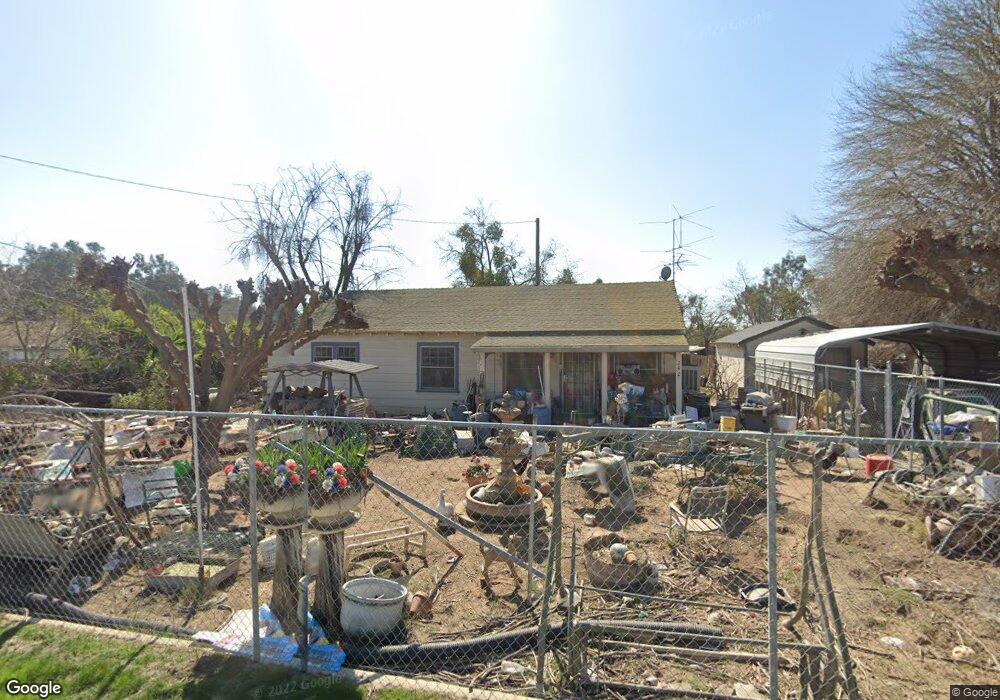
This home is located at 242 E Taylor Rd, Ceres, CA 95307 and is currently estimated at $529,734, approximately $429 per square foot. 242 E Taylor Rd is a home located in Stanislaus County with nearby schools including Westport Elementary School, Blaker-Kinser Junior High School, and Central Valley High School.
Ownership History
Date
Name
Owned For
Owner Type
Purchase Details
Closed on
Oct 15, 2004
Sold by
Hodges Bennie and Hodges Mable R
Bought by
Hodges Bennie L and Hodges Mable R
Current Estimated Value
Purchase Details
Closed on
Jan 5, 2000
Sold by
Hodges and Benie
Bought by
Hodges Bennie and Hodges Mable R
Home Financials for this Owner
Home Financials are based on the most recent Mortgage that was taken out on this home.
Original Mortgage
$33,000
Interest Rate
7.83%
Mortgage Type
Stand Alone Second
Purchase Details
Closed on
Oct 27, 1998
Sold by
Jim Hodges and Jim Bennie
Bought by
Hodges Jim and Hodges Bennie
Home Financials for this Owner
Home Financials are based on the most recent Mortgage that was taken out on this home.
Original Mortgage
$65,000
Interest Rate
6.61%
Purchase Details
Closed on
Dec 22, 1997
Sold by
Jim Hodges
Bought by
Hodges Jim and Hodges Bennie
Create a Home Valuation Report for This Property
The Home Valuation Report is an in-depth analysis detailing your home's value as well as a comparison with similar homes in the area
Purchase History
| Date | Buyer | Sale Price | Title Company |
|---|---|---|---|
| Hodges Bennie L | -- | -- | |
| Hodges Bennie | -- | Fidelity National Title | |
| Hodges Jim | -- | Stewart Title | |
| Hodges Jim | -- | -- | |
| Hodges Bennie | -- | -- |
Source: Public Records
Mortgage History
| Date | Status | Borrower | Loan Amount |
|---|---|---|---|
| Closed | Hodges Bennie | $33,000 | |
| Closed | Hodges Jim | $65,000 |
Source: Public Records
Tax History
| Year | Tax Paid | Tax Assessment Tax Assessment Total Assessment is a certain percentage of the fair market value that is determined by local assessors to be the total taxable value of land and additions on the property. | Land | Improvement |
|---|---|---|---|---|
| 2025 | $1,986 | $165,204 | $121,414 | $43,790 |
| 2024 | $1,869 | $161,966 | $119,034 | $42,932 |
| 2023 | $1,820 | $158,791 | $116,700 | $42,091 |
| 2022 | $1,785 | $155,678 | $114,412 | $41,266 |
| 2021 | $1,768 | $152,626 | $112,169 | $40,457 |
| 2020 | $1,716 | $151,062 | $111,019 | $40,043 |
| 2019 | $1,704 | $148,101 | $108,843 | $39,258 |
| 2018 | $1,670 | $145,198 | $106,709 | $38,489 |
| 2017 | $1,657 | $142,352 | $104,617 | $37,735 |
| 2016 | $1,542 | $139,562 | $102,566 | $36,996 |
| 2015 | $1,521 | $137,467 | $101,026 | $36,441 |
| 2014 | $1,493 | $134,776 | $99,048 | $35,728 |
Source: Public Records
Map
Nearby Homes
- 1237 W Keyes Rd
- 5237 Crows Landing Rd
- 2030 E Grayson Rd Unit 42
- 2030 E Grayson Rd Unit 44
- 2030 E Grayson Rd Unit 26
- 2030 E Grayson Rd Unit 41
- 4396 Admiral Ct
- 4376 Admiral Ct
- 1279 Montclaire Dr
- 8631 Mitchell Rd
- 1440 Don Pedro Rd
- 3816 Teek Ct
- 4449 S Carpenter Rd Unit B12
- 4449 S Carpenter Rd Unit C-1
- 3608 Cassie Ln
- 3816 Dano Ct
- 3449 Guru Dr
- 1628 Sungate Dr
- 3939 Central Ave Unit 157
- 3939 Central Ave Unit 126
- 230 E Taylor Rd
- 300 E Taylor Rd
- 318 E Taylor Rd
- 212 E Taylor Rd
- 324 E Taylor Rd
- 201 E Taylor Rd
- 336 E Taylor Rd
- 148 E Taylor Rd
- 137 E Taylor Rd
- 348 E Taylor Rd
- 7018 Crows Landing Rd
- 131 E Taylor Rd
- 124 E Taylor Rd
- 354 E Taylor Rd
- 400 E Taylor Rd
- 6926 Crows Landing Rd
- 6922 Crows Landing Rd Unit 1
- 6922 Crows Landing Rd
- 6918 Crows Landing Rd
- 406 E Taylor Rd
Your Personal Tour Guide
Ask me questions while you tour the home.