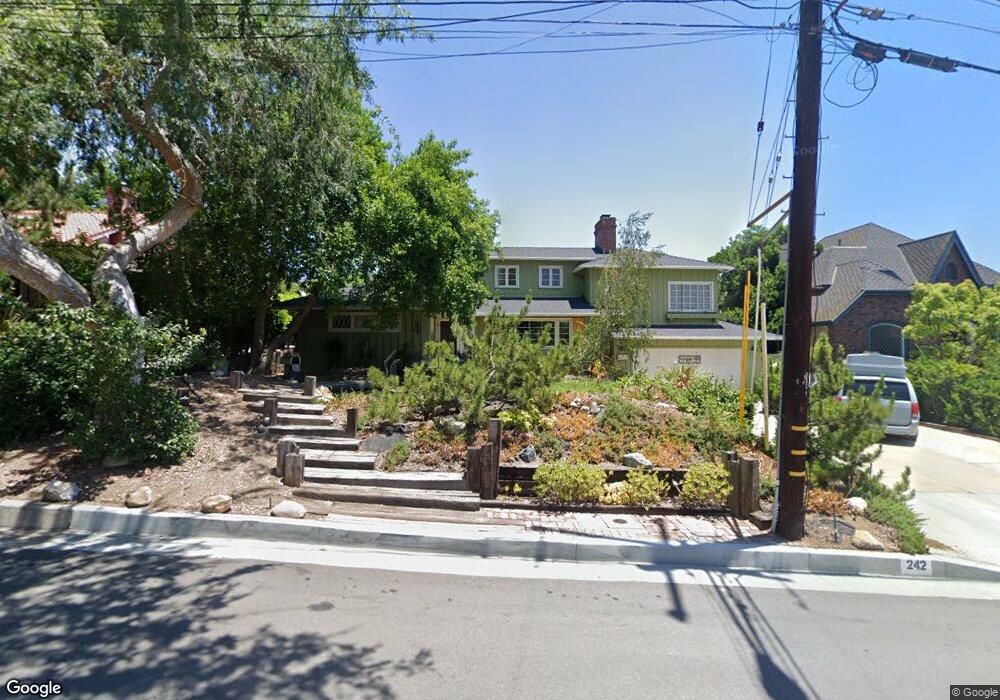
242 El Nido Ave Monrovia, CA 91016
Estimated Value: $1,161,340 - $1,405,000
3
Beds
3
Baths
1,963
Sq Ft
$650/Sq Ft
Est. Value
About This Home
This home is located at 242 El Nido Ave, Monrovia, CA 91016 and is currently estimated at $1,276,585, approximately $650 per square foot. 242 El Nido Ave is a home located in Los Angeles County with nearby schools including Mayflower Elementary School, Clifton Middle School, and Monrovia High School.
Ownership History
Date
Name
Owned For
Owner Type
Purchase Details
Closed on
Feb 26, 2002
Sold by
Daley Thomas K P and Daley Carol L
Bought by
Daley Thomas K P
Current Estimated Value
Home Financials for this Owner
Home Financials are based on the most recent Mortgage that was taken out on this home.
Original Mortgage
$190,000
Outstanding Balance
$77,896
Interest Rate
6.94%
Estimated Equity
$1,198,689
Purchase Details
Closed on
Mar 10, 1994
Sold by
Daley Thomas K P and Daley Carol L
Bought by
Daley Thomas K P
Home Financials for this Owner
Home Financials are based on the most recent Mortgage that was taken out on this home.
Original Mortgage
$202,000
Interest Rate
7.09%
Purchase Details
Closed on
Feb 24, 1994
Sold by
Daley Thomas K P and Daley Carol L
Bought by
Daley Thomas K P
Home Financials for this Owner
Home Financials are based on the most recent Mortgage that was taken out on this home.
Original Mortgage
$202,000
Interest Rate
7.09%
Create a Home Valuation Report for This Property
The Home Valuation Report is an in-depth analysis detailing your home's value as well as a comparison with similar homes in the area
Home Values in the Area
Average Home Value in this Area
Purchase History
| Date | Buyer | Sale Price | Title Company |
|---|---|---|---|
| Daley Thomas K P | -- | American Title Co | |
| Daley Thomas K P | -- | American Title Co | |
| Daley Thomas K P | -- | -- | |
| Daley Thomas K P | -- | Continental Lawyers Title Co |
Source: Public Records
Mortgage History
| Date | Status | Borrower | Loan Amount |
|---|---|---|---|
| Open | Daley Thomas K P | $190,000 | |
| Previous Owner | Daley Thomas K P | $202,000 |
Source: Public Records
Tax History
| Year | Tax Paid | Tax Assessment Tax Assessment Total Assessment is a certain percentage of the fair market value that is determined by local assessors to be the total taxable value of land and additions on the property. | Land | Improvement |
|---|---|---|---|---|
| 2025 | $3,027 | $188,291 | $45,563 | $142,728 |
| 2024 | $2,956 | $184,600 | $44,670 | $139,930 |
| 2023 | $2,892 | $180,982 | $43,795 | $137,187 |
| 2022 | $2,815 | $177,435 | $42,937 | $134,498 |
| 2021 | $2,752 | $173,957 | $42,096 | $131,861 |
| 2020 | $2,680 | $172,174 | $41,665 | $130,509 |
| 2019 | $2,637 | $168,799 | $40,849 | $127,950 |
| 2018 | $2,493 | $165,491 | $40,049 | $125,442 |
| 2016 | $2,381 | $159,067 | $38,495 | $120,572 |
| 2015 | $2,331 | $156,678 | $37,917 | $118,761 |
| 2014 | $2,317 | $153,610 | $37,175 | $116,435 |
Source: Public Records
Map
Nearby Homes
- 725 W Hillcrest Blvd
- 729 W Foothill Blvd
- 325 N Madison Ave
- 112 N Garfield Place
- 328 N Terrace View Dr
- 550 W Foothill Blvd Unit C
- 105 S Mayflower Ave Unit E
- 328 N Alta Vista Ave
- 307 N Terrace View Dr
- 205 Violet Ave Unit D
- 221 Violet Ave
- 516 Linwood Ave
- 402 Lotone St
- 108 Peppertree Ln
- 537 Cloverleaf Dr
- 367 Monterey Pines Dr
- 228 Oaks Ave
- 305 S Mayflower Ave
- 245 W Scenic Dr
- 267 Linwood Ave Unit E
- 248 El Nido Ave
- 236 El Nido Ave
- 232 El Nido Ave
- 252 El Nido Ave
- 237 El Nido Ave
- 247 El Nido Ave
- 629 W Hillcrest Blvd
- 258 El Nido Ave
- 625 W Hillcrest Blvd
- 251 El Nido Ave
- 635 W Hillcrest Blvd
- 639 W Hillcrest Blvd
- 728 Crescent Dr
- 729 Crescent Dr
- 260 El Nido Ave
- 619 W Hillcrest Blvd
- 734 Crescent Dr
- 261 El Nido Ave
- 615 W Hillcrest Blvd
Your Personal Tour Guide
Ask me questions while you tour the home.