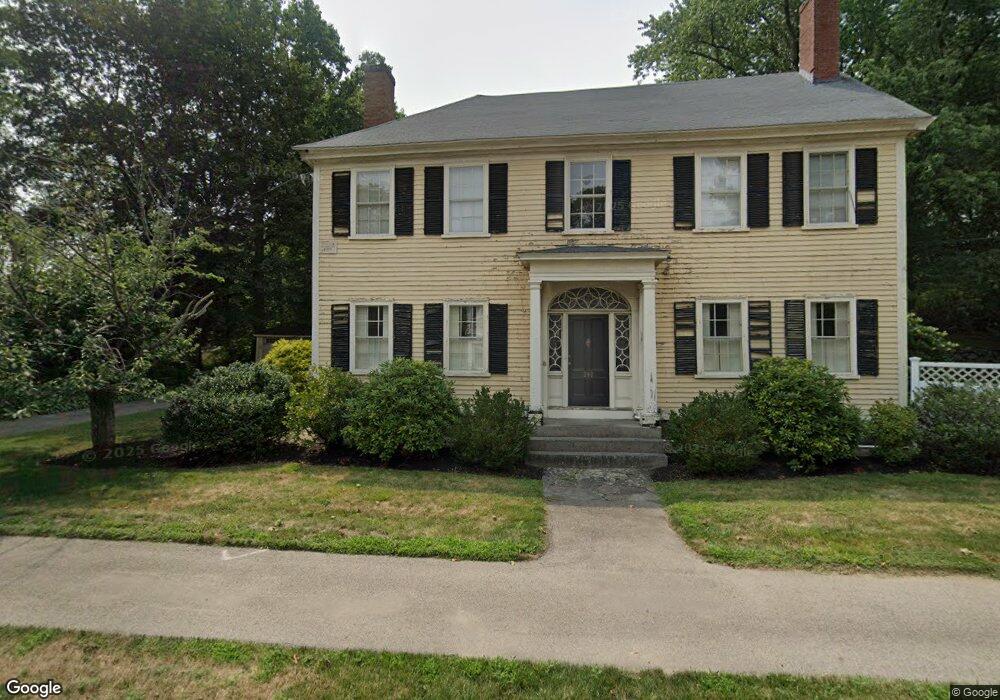
242 Locust St Danvers, MA 01923
Estimated Value: $905,000 - $992,000
4
Beds
3
Baths
3,100
Sq Ft
$304/Sq Ft
Est. Value
About This Home
This home is located at 242 Locust St, Danvers, MA 01923 and is currently estimated at $943,370, approximately $304 per square foot. 242 Locust St is a home located in Essex County with nearby schools including Danvers High School, St. Mary of the Annunciation School, and St. John's Prep.
Ownership History
Date
Name
Owned For
Owner Type
Purchase Details
Closed on
Jul 30, 2004
Sold by
Xchange Solutions Inc and Krause
Bought by
Hanas Matthew M and Hanas Denise R
Current Estimated Value
Purchase Details
Closed on
May 21, 2004
Sold by
Krause Alexander D
Bought by
Xchange Solutions Inc
Purchase Details
Closed on
Aug 4, 1993
Sold by
Hannum Robert W and Hannum Margaret
Bought by
Krause Theodora W and Krause Elliott
Create a Home Valuation Report for This Property
The Home Valuation Report is an in-depth analysis detailing your home's value as well as a comparison with similar homes in the area
Home Values in the Area
Average Home Value in this Area
Purchase History
| Date | Buyer | Sale Price | Title Company |
|---|---|---|---|
| Hanas Matthew M | $569,500 | -- | |
| Xchange Solutions Inc | -- | -- | |
| Krause Theodora W | $305,000 | -- |
Source: Public Records
Mortgage History
| Date | Status | Borrower | Loan Amount |
|---|---|---|---|
| Open | Krause Theodora W | $406,267 | |
| Closed | Krause Theodora W | $409,500 | |
| Closed | Krause Theodora W | $92,500 |
Source: Public Records
Tax History
| Year | Tax Paid | Tax Assessment Tax Assessment Total Assessment is a certain percentage of the fair market value that is determined by local assessors to be the total taxable value of land and additions on the property. | Land | Improvement |
|---|---|---|---|---|
| 2025 | $9,094 | $827,500 | $417,500 | $410,000 |
| 2024 | $9,077 | $817,000 | $417,500 | $399,500 |
| 2023 | $8,382 | $713,400 | $357,800 | $355,600 |
| 2022 | $8,280 | $654,000 | $313,100 | $340,900 |
| 2021 | $7,811 | $585,100 | $256,500 | $328,600 |
| 2020 | $7,641 | $585,100 | $256,500 | $328,600 |
| 2019 | $7,928 | $597,000 | $268,400 | $328,600 |
| 2018 | $7,299 | $539,100 | $265,400 | $273,700 |
| 2017 | $7,543 | $531,600 | $257,900 | $273,700 |
| 2016 | $7,170 | $504,900 | $246,000 | $258,900 |
| 2015 | $7,117 | $477,300 | $223,700 | $253,600 |
Source: Public Records
Map
Nearby Homes
Your Personal Tour Guide
Ask me questions while you tour the home.