F
Seller's Agent in 2015
Frank Godfrey
Keller Williams Preferred Properties
34 Total Sales
Estimated Value: $703,000 - $870,000
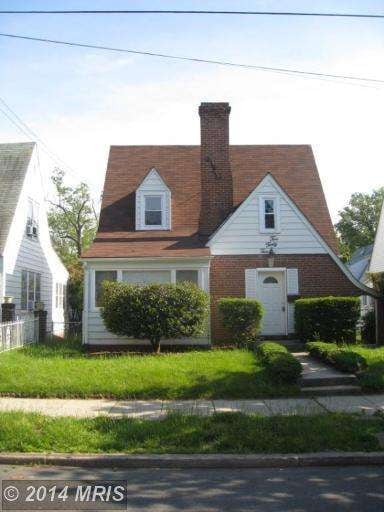
Detached home with detached garage. Walk-able community near Rock Creek Park, Rabaut Recreation Center and Fort Slocum Park. Will not pass FHA203B. So, offers should be FHA 203k, conventional or CASH ONLY
Last Agent to Sell the Property
Keller Williams Preferred Properties License #SP102023 Listed on: 04/30/2014

Last Buyer's Agent
Keller Williams Preferred Properties License #SP102023 Listed on: 04/30/2014
| Date | Buyer | Sale Price | Title Company |
|---|---|---|---|
| Franklin-Zaslavsky Lea C | -- | None Available | |
| Zaslavsky Brian | -- | -- | |
| Wooten Lorenzo | $270,000 | -- | |
| Abell Vincent | $164,546 | -- |
| Date | Status | Borrower | Loan Amount |
|---|---|---|---|
| Open | Zaslavsky Brian P | $40,000 | |
| Open | Franklin | $620,000 | |
| Closed | Franklin-Zaslavsky Lea C | $615,587 | |
| Closed | Zaslavsky Brian | $514,366 | |
| Previous Owner | Wooten Lorenzo | $490,000 | |
| Previous Owner | Wooten Lorenzo | $275,000 | |
| Previous Owner | Wooten Lorenzo | $270,000 |
| Date | Event | Price | Change | Sq Ft Price |
|---|---|---|---|---|
| 07/10/2015 07/10/15 | Sold | $375,000 | -2.6% | $333 / Sq Ft |
| 12/02/2014 12/02/14 | Pending | -- | -- | -- |
| 11/08/2014 11/08/14 | Price Changed | $385,000 | -4.9% | $342 / Sq Ft |
| 10/16/2014 10/16/14 | For Sale | $405,000 | +8.0% | $360 / Sq Ft |
| 09/08/2014 09/08/14 | Pending | -- | -- | -- |
| 08/22/2014 08/22/14 | Off Market | $375,000 | -- | -- |
| 08/10/2014 08/10/14 | Price Changed | $405,000 | 0.0% | $360 / Sq Ft |
| 08/10/2014 08/10/14 | For Sale | $405,000 | +8.0% | $360 / Sq Ft |
| 08/08/2014 08/08/14 | Off Market | $375,000 | -- | -- |
| 07/21/2014 07/21/14 | For Sale | $417,500 | 0.0% | $371 / Sq Ft |
| 05/10/2014 05/10/14 | Price Changed | $417,500 | +11.3% | $371 / Sq Ft |
| 05/09/2014 05/09/14 | Pending | -- | -- | -- |
| 05/08/2014 05/08/14 | Off Market | $375,000 | -- | -- |
| 04/30/2014 04/30/14 | For Sale | $399,000 | -- | $355 / Sq Ft |
| Year | Tax Paid | Tax Assessment Tax Assessment Total Assessment is a certain percentage of the fair market value that is determined by local assessors to be the total taxable value of land and additions on the property. | Land | Improvement |
|---|---|---|---|---|
| 2024 | $6,042 | $797,880 | $365,520 | $432,360 |
| 2023 | $5,704 | $769,870 | $360,750 | $409,120 |
| 2022 | $5,230 | $694,030 | $323,080 | $370,950 |
| 2021 | $4,958 | $659,590 | $312,600 | $346,990 |
| 2020 | $4,812 | $641,790 | $299,460 | $342,330 |
| 2019 | $4,761 | $634,910 | $284,300 | $350,610 |
| 2018 | $4,565 | $610,450 | $0 | $0 |
| 2017 | $4,196 | $590,430 | $0 | $0 |
| 2016 | $3,206 | $377,230 | $0 | $0 |
| 2015 | $2,841 | $334,250 | $0 | $0 |
| 2014 | $2,419 | $284,570 | $0 | $0 |
F
Seller's Agent in 2015
Frank Godfrey
Keller Williams Preferred Properties
34 Total Sales
Source: Bright MLS
MLS Number: 1002965652
APN: 3337-0089
Disclaimer: Certain information contained herein is derived from information provided by parties other than Homes.com. All information provided is deemed reliable, but is not guaranteed to be accurate and should be independently verified.
![]() The data relating to real estate for sale on this website appears in part through the BRIGHT Internet Data Exchange program, a voluntary cooperative exchange of property listing data between licensed real estate brokerage firms, and is provided by BRIGHT through a licensing agreement.
The data relating to real estate for sale on this website appears in part through the BRIGHT Internet Data Exchange program, a voluntary cooperative exchange of property listing data between licensed real estate brokerage firms, and is provided by BRIGHT through a licensing agreement.
Listing information is from various brokers who participate in the Bright MLS IDX program and not all listings may be visible on the site.
The property information being provided on or through the website is for the personal, non-commercial use of consumers and such information may not be used for any purpose other than to identify prospective properties consumers may be interested in purchasing.
Some properties which appear for sale on the website may no longer be available because they are for instance, under contract, sold or are no longer being offered for sale.
Property information displayed is deemed reliable but is not guaranteed.
Copyright 2025 Bright MLS, Inc.