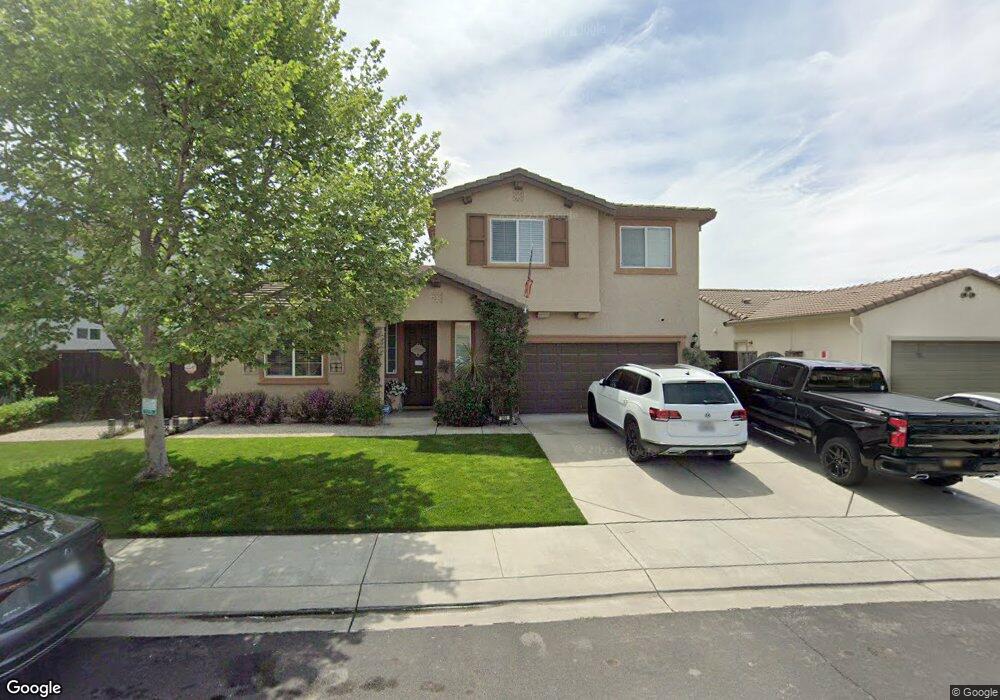
242 Via Del Sol Vacaville, CA 95687
Estimated Value: $728,000 - $769,000
4
Beds
3
Baths
2,272
Sq Ft
$328/Sq Ft
Est. Value
About This Home
This home is located at 242 Via Del Sol, Vacaville, CA 95687 and is currently estimated at $746,208, approximately $328 per square foot. 242 Via Del Sol is a home located in Solano County with nearby schools including Cambridge Elementary School, Golden West Middle School, and Vanden High School.
Ownership History
Date
Name
Owned For
Owner Type
Purchase Details
Closed on
Nov 23, 2022
Sold by
Scerbo Pasquale and Scerbo Nicole M
Bought by
Scerbo Family Trust
Current Estimated Value
Purchase Details
Closed on
Aug 21, 2015
Sold by
Golvin Anthony and Colvin Stephanie
Bought by
Scerbo Pasquale and Scerbo Nicole M
Home Financials for this Owner
Home Financials are based on the most recent Mortgage that was taken out on this home.
Original Mortgage
$356,000
Interest Rate
4.05%
Mortgage Type
New Conventional
Purchase Details
Closed on
Mar 17, 2011
Sold by
Meritage Homes Of California Inc
Bought by
Colvin Anthony and Colvin Stephanie
Home Financials for this Owner
Home Financials are based on the most recent Mortgage that was taken out on this home.
Original Mortgage
$365,165
Interest Rate
4.83%
Mortgage Type
VA
Create a Home Valuation Report for This Property
The Home Valuation Report is an in-depth analysis detailing your home's value as well as a comparison with similar homes in the area
Home Values in the Area
Average Home Value in this Area
Purchase History
| Date | Buyer | Sale Price | Title Company |
|---|---|---|---|
| Scerbo Family Trust | -- | -- | |
| Scerbo Pasquale | $447,500 | Placer Title Company | |
| Colvin Anthony | $353,500 | First American Title Company |
Source: Public Records
Mortgage History
| Date | Status | Borrower | Loan Amount |
|---|---|---|---|
| Previous Owner | Scerbo Pasquale | $356,000 | |
| Previous Owner | Colvin Anthony | $365,165 |
Source: Public Records
Tax History Compared to Growth
Tax History
| Year | Tax Paid | Tax Assessment Tax Assessment Total Assessment is a certain percentage of the fair market value that is determined by local assessors to be the total taxable value of land and additions on the property. | Land | Improvement |
|---|---|---|---|---|
| 2025 | $8,437 | $549,086 | $147,971 | $401,115 |
| 2024 | $8,437 | $538,320 | $145,070 | $393,250 |
| 2023 | $8,266 | $527,766 | $142,227 | $385,539 |
| 2022 | $8,189 | $517,419 | $139,439 | $377,980 |
| 2021 | $8,159 | $507,274 | $136,705 | $370,569 |
| 2020 | $8,061 | $502,074 | $135,304 | $366,770 |
| 2019 | $7,920 | $492,230 | $132,651 | $359,579 |
| 2018 | $7,712 | $482,579 | $130,050 | $352,529 |
| 2017 | $7,231 | $456,450 | $127,500 | $328,950 |
| 2016 | $7,032 | $447,500 | $125,000 | $322,500 |
| 2015 | $6,151 | $376,831 | $106,600 | $270,231 |
| 2014 | $6,014 | $369,450 | $104,512 | $264,938 |
Source: Public Records
Map
Nearby Homes
- 236 Cogburn Way
- 2031 Newcastle Dr
- 4054 Camden Ct
- 448 Potters Ln
- 918 Moonstone Ct
- 846 Engineer Cir
- Plan 1549 - Modeled at Sweetbay at Magnolia Park
- Plan 2532 at Sweetbay at Magnolia Park
- Plan 1963 at Sweetbay at Magnolia Park
- 113 Mechanic Ln
- 3510 Nut Tree Rd
- 822 Engineer Cir
- 4012 Drafter Ct
- 357 Colonial Cir
- 644 Canterbury Cir
- 2384 Newcastle Dr
- 8000 Carpenter Ct
- 2367 Newcastle Dr
- 810 Engineer Cir
- 2390 Newcastle Dr
- 242 Via Del Sol Unkn
- 236 Via Del Sol
- 236 Via Del Sol Unkn
- 230 Wimbledon Dr
- 236 Wimbledon Dr
- 254 Via Del Sol
- 254 Via Del Sol
- 254 Via Del Sol
- 230 Via Del Sol
- 254 Via Del Sol Unkn
- 224 Wimbledon Dr
- 243 Via Del Sol
- 242 Wimbledon Dr
- 237 Via Del Sol
- 249 Via Del Sol
- 249 Via Del Sol
- 218 Wimbledon Dr
- 255 Via Del Sol
- 255 Via Del Sol Unkn
- 237 Via Del Sol Unkn