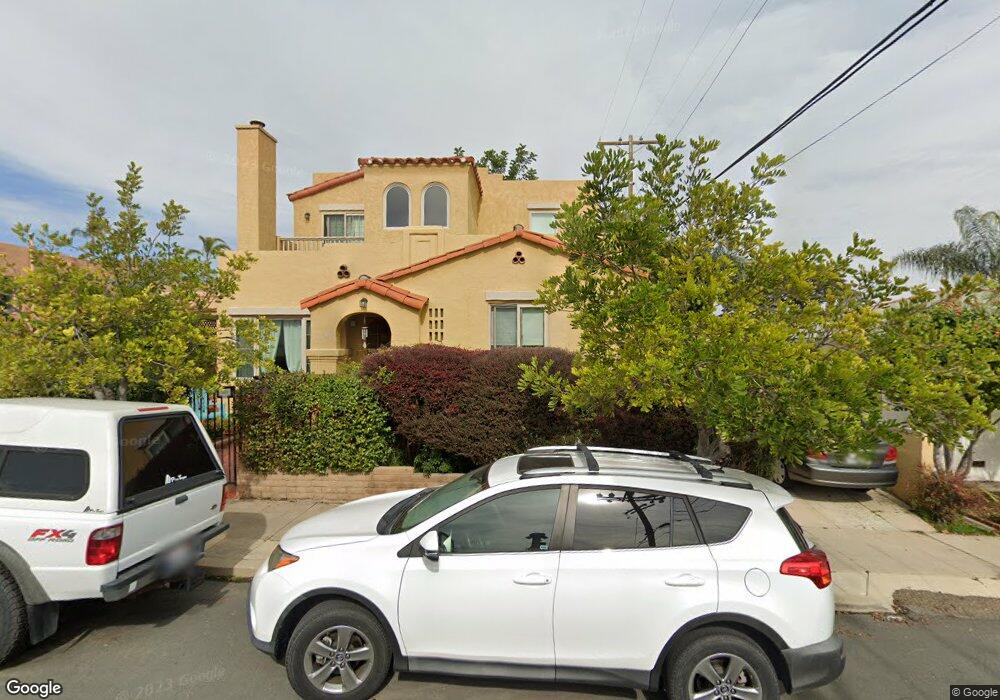
2420 Dwight St San Diego, CA 92104
North Park NeighborhoodEstimated Value: $1,178,774 - $1,447,000
4
Beds
3
Baths
1,367
Sq Ft
$973/Sq Ft
Est. Value
About This Home
This home is located at 2420 Dwight St, San Diego, CA 92104 and is currently estimated at $1,330,444, approximately $973 per square foot. 2420 Dwight St is a home located in San Diego County with nearby schools including Jefferson Elementary, Roosevelt International Middle School, and Kindred Montessori.
Ownership History
Date
Name
Owned For
Owner Type
Purchase Details
Closed on
Aug 1, 2016
Sold by
Kirkish Alex N and Kirkish Christine B
Bought by
Kirkish Alex N and Kirkish Christina Beck
Current Estimated Value
Purchase Details
Closed on
Apr 14, 2008
Sold by
Kirkish Alex N and Kirkish Christina B
Bought by
Kirkish Alexander N and Kirkish Christina B
Home Financials for this Owner
Home Financials are based on the most recent Mortgage that was taken out on this home.
Original Mortgage
$225,000
Outstanding Balance
$142,677
Interest Rate
5.99%
Mortgage Type
New Conventional
Estimated Equity
$1,187,767
Purchase Details
Closed on
Feb 21, 1997
Sold by
Anderson Philip A
Bought by
Kirkish Alex N and Kirkish Christina B
Home Financials for this Owner
Home Financials are based on the most recent Mortgage that was taken out on this home.
Original Mortgage
$135,184
Interest Rate
7.63%
Mortgage Type
FHA
Purchase Details
Closed on
Aug 26, 1991
Purchase Details
Closed on
Jan 23, 1985
Create a Home Valuation Report for This Property
The Home Valuation Report is an in-depth analysis detailing your home's value as well as a comparison with similar homes in the area
Home Values in the Area
Average Home Value in this Area
Purchase History
| Date | Buyer | Sale Price | Title Company |
|---|---|---|---|
| Kirkish Alex N | -- | None Available | |
| Kirkish Alexander N | -- | California Title Co | |
| Kirkish Alex N | $147,000 | First American Title | |
| -- | $160,000 | -- | |
| -- | $85,000 | -- |
Source: Public Records
Mortgage History
| Date | Status | Borrower | Loan Amount |
|---|---|---|---|
| Open | Kirkish Alexander N | $225,000 | |
| Closed | Kirkish Alex N | $135,184 |
Source: Public Records
Tax History Compared to Growth
Tax History
| Year | Tax Paid | Tax Assessment Tax Assessment Total Assessment is a certain percentage of the fair market value that is determined by local assessors to be the total taxable value of land and additions on the property. | Land | Improvement |
|---|---|---|---|---|
| 2025 | $4,146 | $345,921 | $122,133 | $223,788 |
| 2024 | $4,146 | $339,139 | $119,739 | $219,400 |
| 2023 | $4,052 | $332,491 | $117,392 | $215,099 |
| 2022 | $3,941 | $325,973 | $115,091 | $210,882 |
| 2021 | $3,911 | $319,583 | $112,835 | $206,748 |
| 2020 | $3,863 | $316,308 | $111,679 | $204,629 |
| 2019 | $3,793 | $310,107 | $109,490 | $200,617 |
| 2018 | $3,546 | $304,028 | $107,344 | $196,684 |
| 2017 | $3,460 | $298,068 | $105,240 | $192,828 |
| 2016 | $3,403 | $292,225 | $103,177 | $189,048 |
| 2015 | $2,470 | $212,837 | $101,628 | $111,209 |
| 2014 | $2,257 | $193,963 | $99,638 | $94,325 |
Source: Public Records
Map
Nearby Homes
- 3537 Louisiana St
- 3533 Louisiana St
- 3536 Louisiana St
- 3660 Mississippi St
- 3736-38 Louisiana St
- 3693 Villa Terrace
- 2618 Landis St
- 3764 Villa Terrace
- 3805 Louisiana St
- 3776 Villa Terrace
- 3660 28th St
- 3776 Alabama St Unit 116
- 3776 Alabama St Unit 117
- 3405 Florida St Unit 410
- 3796 Alabama St Unit 118
- 3796 Alabama St Unit 304
- 3760 Florida St
- 3760 Florida St Unit 209
- 3420-30 Wilshire Terrace
- 1907 Robinson Ave Unit 309
- 2426 Dwight St
- 3611 Texas St Unit 13
- 3605 Texas St
- 3616 Arizona St
- 3621 Texas St
- 3608 Arizona St
- 3595 Texas St
- 3622 Arizona St
- 3596 Arizona St
- 3629 Texas St
- 3583-85 Texas St
- 3630 Arizona St
- 3583 Texas St Unit 85
- 3588 Arizona St
- 3578 Arizona St Unit 80
- 3636 Arizona St
- 3635 Texas St
- 3575 Texas St
- 3596 Texas St
- 3642 Arizona St