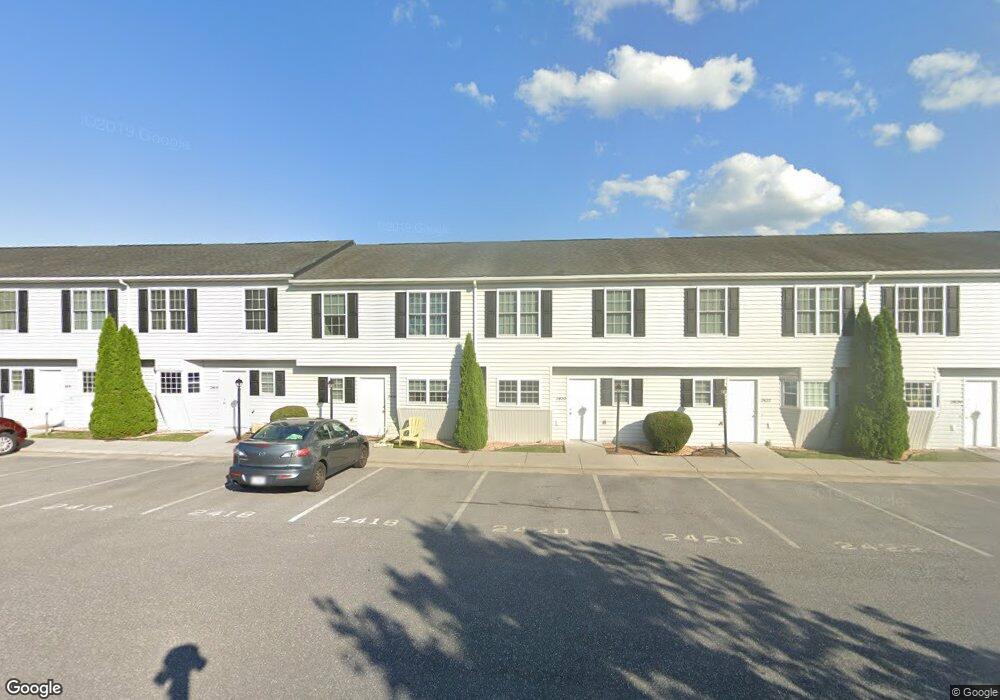
2420 Millwood Loop Unit 18 Harrisonburg, VA 22801
Estimated Value: $213,000 - $222,359
2
Beds
3
Baths
1,260
Sq Ft
$172/Sq Ft
Est. Value
About This Home
This home is located at 2420 Millwood Loop Unit 18, Harrisonburg, VA 22801 and is currently estimated at $216,590, approximately $171 per square foot. 2420 Millwood Loop Unit 18 is a home located in Harrisonburg City with nearby schools including Bluestone Elementary, Thomas Harrison Middle School, and Harrisonburg High School.
Ownership History
Date
Name
Owned For
Owner Type
Purchase Details
Closed on
Jun 4, 2013
Sold by
Park View Federal Credit Union
Bought by
Ridder A Jackson and Ridder Linda
Current Estimated Value
Home Financials for this Owner
Home Financials are based on the most recent Mortgage that was taken out on this home.
Original Mortgage
$81,000
Outstanding Balance
$57,268
Interest Rate
3.43%
Mortgage Type
Credit Line Revolving
Estimated Equity
$159,322
Purchase Details
Closed on
Nov 27, 2012
Sold by
Stepanov Aleksandr
Bought by
Park Federal Credit Union
Purchase Details
Closed on
Dec 31, 2010
Sold by
Stepanov Nadezhda
Bought by
Stepanov Aleksandr
Purchase Details
Closed on
Oct 17, 2007
Sold by
Virginia Valley Homes Inc
Bought by
Stepanov Aleksander and Stepanov Nadezhda
Home Financials for this Owner
Home Financials are based on the most recent Mortgage that was taken out on this home.
Original Mortgage
$113,600
Interest Rate
7.25%
Mortgage Type
Adjustable Rate Mortgage/ARM
Create a Home Valuation Report for This Property
The Home Valuation Report is an in-depth analysis detailing your home's value as well as a comparison with similar homes in the area
Home Values in the Area
Average Home Value in this Area
Purchase History
| Date | Buyer | Sale Price | Title Company |
|---|---|---|---|
| Ridder A Jackson | $90,000 | Members Title-Pvfcu | |
| Park Federal Credit Union | $143,318 | Members Title Pvfcu | |
| Stepanov Aleksandr | -- | Members Title-Pvfcu | |
| Stepanov Aleksander | $142,000 | Members Title |
Source: Public Records
Mortgage History
| Date | Status | Borrower | Loan Amount |
|---|---|---|---|
| Open | Ridder A Jackson | $81,000 | |
| Previous Owner | Stepanov Aleksander | $113,600 |
Source: Public Records
Tax History Compared to Growth
Tax History
| Year | Tax Paid | Tax Assessment Tax Assessment Total Assessment is a certain percentage of the fair market value that is determined by local assessors to be the total taxable value of land and additions on the property. | Land | Improvement |
|---|---|---|---|---|
| 2025 | $1,781 | $189,200 | $40,000 | $149,200 |
| 2024 | $1,781 | $176,300 | $34,000 | $142,300 |
| 2023 | $1,518 | $158,100 | $30,000 | $128,100 |
| 2022 | $1,360 | $146,200 | $28,000 | $118,200 |
| 2021 | $1,119 | $124,300 | $20,000 | $104,300 |
| 2020 | $1,057 | $122,200 | $20,000 | $102,200 |
| 2019 | $969 | $112,000 | $20,000 | $92,000 |
| 2018 | $825 | $110,600 | $20,000 | $90,600 |
| 2017 | $825 | $110,600 | $20,000 | $90,600 |
| 2016 | $825 | $114,600 | $24,000 | $90,600 |
| 2015 | $825 | $114,600 | $24,000 | $90,600 |
| 2014 | -- | $114,600 | $24,000 | $90,600 |
Source: Public Records
Map
Nearby Homes
- 2414 Millwood Loop Unit 15
- 210 W Mosby Rd
- 2105 Willow Hill Dr
- 2102 Willow Hill Dr
- 2112 Willow Hill Dr
- 745 Wingtip Way
- 2122 Willow Hill Dr
- 2132 Willow Hill Dr
- 2020 Shoeshine Ave
- 550 Grommet Dr
- 521 Hickory Grove Cir
- 1739 Kingston Ct
- 3195 Joppa Ct
- 3200 Joppa Ct
- 1435 Bluestone St
- 1450 Bluestone St
- 52 South Ave Unit G
- 324 Diana Ct
- 33 Port Republic Rd
- 1309 Bradley Dr
- 2418 Millwood Loop Unit 17
- 2422 Millwood Loop Unit 19
- 2416 Millwood Loop Unit 16
- 2424 Millwood Loop Unit 20
- 2426 Millwood Loop Unit 21
- 2412 Millwood Loop Unit 14
- 2428 Millwood Loop Unit 22
- 2410 Millwood Loop Unit 13
- 2432 Millwood Loop Unit 23
- 2423 Millwood Loop Unit 2
- 2434 Millwood Loop Unit 24
- 2425 Millwood Loop Unit 3
- 2421 Millwood Loop Unit 1
- 2441 Millwood Loop Unit 11
- 2427 Millwood Loop Unit 4
- 2436 Millwood Loop Unit 25
- 2439 Millwood Loop Unit 10
- 2459 Mosby Ct Unit 19
- 2437 Mosby Ct Unit 18
- 2429 Millwood Loop Unit 5