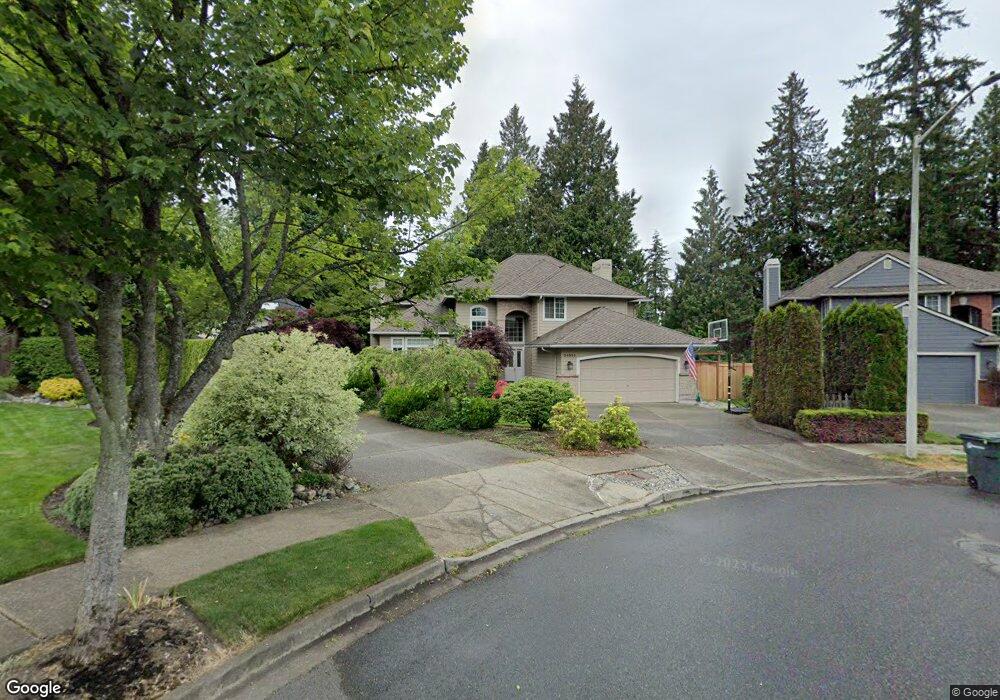
24202 25th Ave SE Bothell, WA 98021
Canyon Park NeighborhoodEstimated Value: $1,114,000 - $1,472,000
3
Beds
3
Baths
2,474
Sq Ft
$535/Sq Ft
Est. Value
About This Home
This home is located at 24202 25th Ave SE, Bothell, WA 98021 and is currently estimated at $1,323,029, approximately $534 per square foot. 24202 25th Ave SE is a home located in Snohomish County with nearby schools including Maywood Hills Elementary School, Canyon Park Junior High School, and Bothell High School.
Ownership History
Date
Name
Owned For
Owner Type
Purchase Details
Closed on
Feb 11, 2020
Sold by
Westin Patricia L
Bought by
Westin Bradley R
Current Estimated Value
Home Financials for this Owner
Home Financials are based on the most recent Mortgage that was taken out on this home.
Original Mortgage
$400,000
Outstanding Balance
$354,976
Interest Rate
3.72%
Mortgage Type
New Conventional
Estimated Equity
$968,053
Purchase Details
Closed on
Nov 19, 1997
Sold by
Aeilts Mark L and Aeilts Melissa L
Bought by
Sheeran James Q and Sheeran Rona M
Home Financials for this Owner
Home Financials are based on the most recent Mortgage that was taken out on this home.
Original Mortgage
$247,500
Interest Rate
7.23%
Purchase Details
Closed on
Dec 22, 1995
Sold by
Bamyan Investment Inc
Bought by
Aeilts Mark L and Aeilts Melissa L
Home Financials for this Owner
Home Financials are based on the most recent Mortgage that was taken out on this home.
Original Mortgage
$185,000
Interest Rate
7.37%
Mortgage Type
Balloon
Create a Home Valuation Report for This Property
The Home Valuation Report is an in-depth analysis detailing your home's value as well as a comparison with similar homes in the area
Home Values in the Area
Average Home Value in this Area
Purchase History
| Date | Buyer | Sale Price | Title Company |
|---|---|---|---|
| Westin Bradley R | -- | Cw Title | |
| Sheeran James Q | $275,000 | -- | |
| Aeilts Mark L | $235,000 | -- |
Source: Public Records
Mortgage History
| Date | Status | Borrower | Loan Amount |
|---|---|---|---|
| Open | Westin Bradley R | $400,000 | |
| Closed | Sheeran James Q | $247,500 | |
| Previous Owner | Aeilts Mark L | $185,000 |
Source: Public Records
Tax History Compared to Growth
Tax History
| Year | Tax Paid | Tax Assessment Tax Assessment Total Assessment is a certain percentage of the fair market value that is determined by local assessors to be the total taxable value of land and additions on the property. | Land | Improvement |
|---|---|---|---|---|
| 2025 | $8,981 | $1,207,500 | $755,000 | $452,500 |
| 2024 | $8,981 | $1,076,000 | $660,000 | $416,000 |
| 2023 | $9,513 | $1,246,300 | $765,000 | $481,300 |
| 2022 | $8,411 | $888,500 | $480,000 | $408,500 |
| 2020 | $7,981 | $782,500 | $431,000 | $351,500 |
| 2019 | $6,771 | $687,100 | $350,000 | $337,100 |
| 2018 | $6,232 | $609,300 | $305,000 | $304,300 |
| 2017 | $5,441 | $538,400 | $255,000 | $283,400 |
| 2016 | $4,861 | $496,500 | $225,000 | $271,500 |
| 2015 | $4,791 | $463,700 | $210,000 | $253,700 |
| 2013 | $4,393 | $374,100 | $167,000 | $207,100 |
Source: Public Records
Map
Nearby Homes
- 1912 243rd Place SE
- 3520 237th St SE Unit 45
- 20015 108th Ave NE
- 1448 238th St SE
- 1442 238th St SE
- 23825 15th Ave SE Unit 93
- 23825 15th Ave SE Unit 183
- 23825 15th Ave SE Unit 159
- 23210 27th Ave SE Unit 2
- 23210 27th Ave SE Unit 1
- 23214 27th Ave SE Unit 2
- 10046 NE 196th Place
- 9925 NE 197th St
- 23930 36 Ave SE Unit 8
- Plan 2330 Modeled at Greenleaf Grove
- Plan 2605 at Greenleaf Grove
- Plan 2755 at Greenleaf Grove
- Plan 2070 at Greenleaf Grove
- Plan 2350 at Greenleaf Grove
- Plan 2745 at Greenleaf Grove
- 24208 25th Ave SE
- 24201 25th Ave SE
- 2432 241st St SE
- 24214 25th Ave SE
- 2506 241st St SE
- 2424 241st St SE
- 24207 25th Ave SE
- 2413 242nd Place SE Unit 7
- 24215 25th Ave SE
- 24220 25th Ave SE
- 2514 241st St SE
- 24223 25th Ave SE
- 2416 241st St SE
- 2417 242nd Place SE Unit 8
- 2429 241st St SE
- 24219 25th Ave SE
- 2505 241st St SE
- 24217 23rd Ave SE
- 24203 25th Ave SE
- 2419 241st St SE