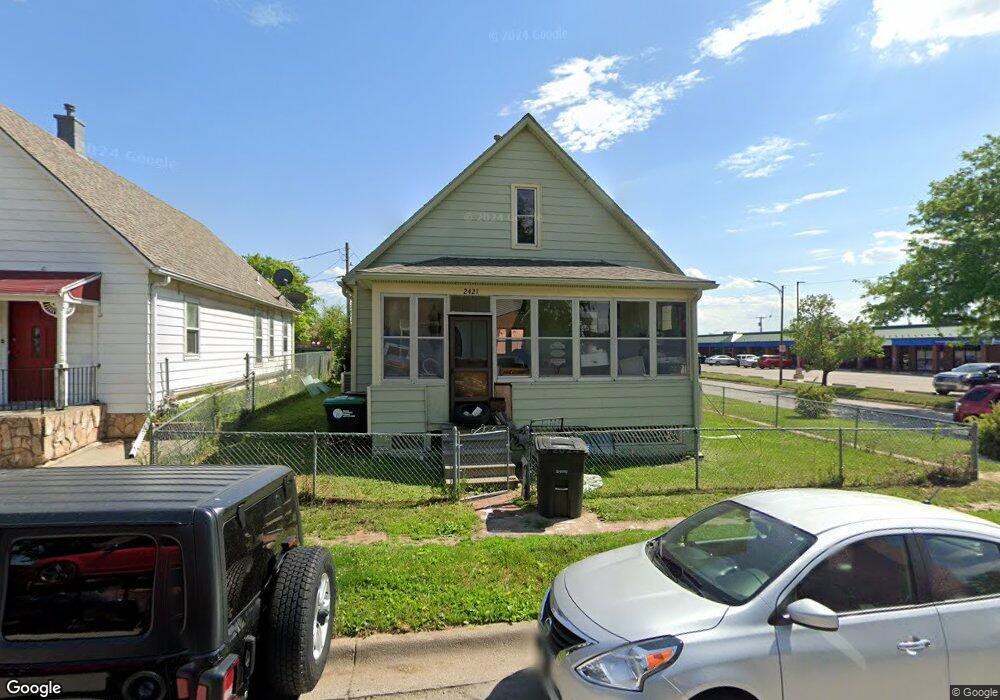
2421 K St Omaha, NE 68107
South Central Omaha NeighborhoodEstimated Value: $122,363 - $172,000
2
Beds
1
Bath
1,000
Sq Ft
$146/Sq Ft
Est. Value
About This Home
This home is located at 2421 K St, Omaha, NE 68107 and is currently estimated at $145,841, approximately $145 per square foot. 2421 K St is a home located in Douglas County with nearby schools including Gomez Heritage Elementary School, R.M. Marrs Magnet Middle School, and South High School.
Ownership History
Date
Name
Owned For
Owner Type
Purchase Details
Closed on
Mar 15, 2024
Sold by
Lopez Humberto
Bought by
Ocon Delopez Manuela
Current Estimated Value
Purchase Details
Closed on
Apr 27, 2022
Sold by
Oscan Bancera
Bought by
Rbj One Real Estate Llc
Purchase Details
Closed on
Sep 6, 2017
Sold by
Garcia Maria V
Bought by
Lopez Humberto
Purchase Details
Closed on
Mar 8, 2011
Sold by
Lopez Humberto and Lopez Manuela
Bought by
Garcia Maria Vega and Camarena Jose Rosario Tapia
Purchase Details
Closed on
Feb 24, 2011
Sold by
Stephen Center Inc
Bought by
Lopez Humberto and Lopez Manuela
Create a Home Valuation Report for This Property
The Home Valuation Report is an in-depth analysis detailing your home's value as well as a comparison with similar homes in the area
Home Values in the Area
Average Home Value in this Area
Purchase History
| Date | Buyer | Sale Price | Title Company |
|---|---|---|---|
| Ocon Delopez Manuela | -- | None Listed On Document | |
| Rbj One Real Estate Llc | $99,000 | None Listed On Document | |
| Lopez Humberto | $25,000 | None Available | |
| Garcia Maria Vega | $30,000 | None Available | |
| Lopez Humberto | $30,000 | None Available |
Source: Public Records
Tax History Compared to Growth
Tax History
| Year | Tax Paid | Tax Assessment Tax Assessment Total Assessment is a certain percentage of the fair market value that is determined by local assessors to be the total taxable value of land and additions on the property. | Land | Improvement |
|---|---|---|---|---|
| 2025 | $1,141 | $70,000 | $9,300 | $60,700 |
| 2024 | $1,411 | $70,000 | $9,300 | $60,700 |
| 2023 | $1,411 | $66,900 | $9,300 | $57,600 |
| 2022 | $1,452 | $68,000 | $10,400 | $57,600 |
| 2021 | $1,278 | $60,400 | $10,400 | $50,000 |
| 2020 | $1,300 | $60,700 | $4,000 | $56,700 |
| 2019 | $1,026 | $47,800 | $4,000 | $43,800 |
| 2018 | $765 | $35,600 | $4,000 | $31,600 |
| 2017 | $769 | $35,600 | $4,000 | $31,600 |
| 2016 | $764 | $35,600 | $4,000 | $31,600 |
| 2015 | $754 | $35,600 | $4,000 | $31,600 |
| 2014 | $754 | $35,600 | $4,000 | $31,600 |
Source: Public Records
Map
Nearby Homes