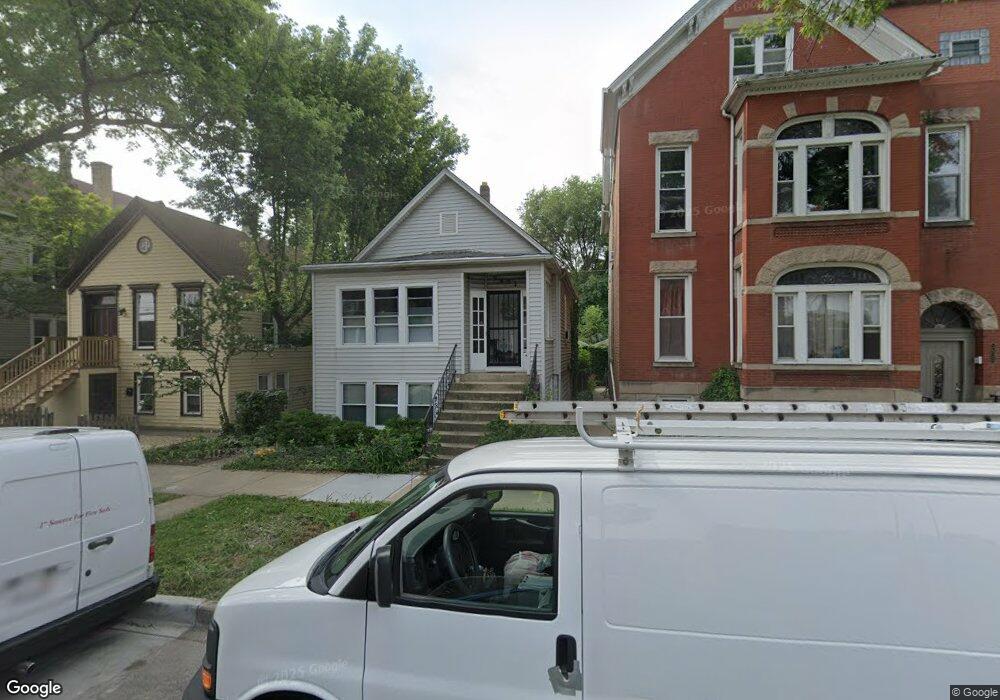
2421 W Medill Ave Chicago, IL 60647
Logan Square NeighborhoodEstimated Value: $461,000 - $706,011
2
Beds
1
Bath
872
Sq Ft
$677/Sq Ft
Est. Value
About This Home
This home is located at 2421 W Medill Ave, Chicago, IL 60647 and is currently estimated at $590,003, approximately $676 per square foot. 2421 W Medill Ave is a home located in Cook County with nearby schools including Goethe Elementary School, Clemente Community Academy High School, and CICS - Bucktown Campus.
Ownership History
Date
Name
Owned For
Owner Type
Purchase Details
Closed on
Sep 20, 2024
Sold by
Here To Stay Clt Inc
Bought by
Osgood Zac
Current Estimated Value
Purchase Details
Closed on
Dec 6, 2023
Sold by
Annette A Scheetz Revocable Living Trust
Bought by
Stay Clt Inc
Purchase Details
Closed on
Jun 25, 2021
Sold by
Scheetz Annette A and Scheetz Annette A
Bought by
Scheetz Annette A and Annette A Scheetz Revocable Li
Purchase Details
Closed on
Jan 23, 2019
Sold by
Scheetz Annette A
Bought by
The Annette A Scheetz And James R Rhodes
Purchase Details
Closed on
Sep 24, 2002
Sold by
Clausen Wieslawa
Bought by
Rhodes James R and Scheetz Anne
Purchase Details
Closed on
Jan 22, 1996
Sold by
Clausen Richard H
Bought by
Clausen Wieslawa
Purchase Details
Closed on
Jun 22, 1995
Sold by
Clausen Richard H
Bought by
Clausen Wieslawa
Create a Home Valuation Report for This Property
The Home Valuation Report is an in-depth analysis detailing your home's value as well as a comparison with similar homes in the area
Home Values in the Area
Average Home Value in this Area
Purchase History
| Date | Buyer | Sale Price | Title Company |
|---|---|---|---|
| Osgood Zac | -- | None Listed On Document | |
| Stay Clt Inc | -- | None Listed On Document | |
| Scheetz Annette A | -- | None Available | |
| The Annette A Scheetz And James R Rhodes | -- | None Available | |
| Rhodes James R | $270,000 | -- | |
| Clausen Wieslawa | -- | -- | |
| Clausen Wieslawa | -- | -- |
Source: Public Records
Tax History Compared to Growth
Tax History
| Year | Tax Paid | Tax Assessment Tax Assessment Total Assessment is a certain percentage of the fair market value that is determined by local assessors to be the total taxable value of land and additions on the property. | Land | Improvement |
|---|---|---|---|---|
| 2024 | $9,105 | $47,000 | $18,099 | $28,901 |
| 2023 | $8,875 | $43,000 | $14,544 | $28,456 |
| 2022 | $8,875 | $43,000 | $14,544 | $28,456 |
| 2021 | $8,675 | $43,000 | $14,544 | $28,456 |
| 2020 | $7,451 | $33,325 | $8,241 | $25,084 |
| 2019 | $7,466 | $37,028 | $8,241 | $28,787 |
| 2018 | $7,314 | $37,028 | $8,241 | $28,787 |
| 2017 | $4,063 | $18,874 | $7,272 | $11,602 |
| 2016 | $3,780 | $18,874 | $7,272 | $11,602 |
| 2015 | $3,459 | $18,874 | $7,272 | $11,602 |
| 2014 | $3,495 | $18,839 | $6,464 | $12,375 |
| 2013 | $3,426 | $18,839 | $6,464 | $12,375 |
Source: Public Records
Map
Nearby Homes
- 2423 W Fullerton Ave Unit 4G
- 2413 W Fullerton Ave Unit 3
- 2429-2431 W Fullerton Ave
- 2535 W Belden Ave
- 2546 W Medill Ave
- 2531 W Lyndale St
- 2208 N Oakley Ave Unit 1N
- 2329 N Oakley Ave Unit 3E
- 2451 N Campbell Ave
- 2574 W Lyndale St Unit 2
- 2578 W Lyndale St Unit 2
- 2735 N Campbell Ave
- 2342 W Altgeld St
- 2301 N Rockwell St Unit 3
- 2246 W Lyndale St Unit 2
- 2503 N Maplewood Ave
- 2418 W Charleston St
- 2151 N Oakley Ave
- 2168 N Rockwell St
- 2515 W Charleston St
- 2417 W Medill Ave
- 2425 W Medill Ave
- 2425 W Medill Ave Unit 1
- 2427 W Medill Ave
- 2415 W Medill Ave
- 2420 W Belden Ave Unit 2
- 2420 W Belden Ave Unit 1
- 2420 W Belden Ave Unit G2
- 2422 W Belden Ave
- 2426 W Belden Ave
- 2412 W Belden Ave
- 2412 W Belden Ave
- 2412 W Belden Ave Unit 2F
- 2412 W Belden Ave Unit 1R
- 2412 W Belden Ave Unit 2R
- 2412 W Belden Ave Unit 1F
- 2412 W Belden Ave Unit CH
- 2412 W Belden Ave Unit 2F
- 2418 W Medill Ave Unit 1
- 2418 W Medill Ave Unit 1