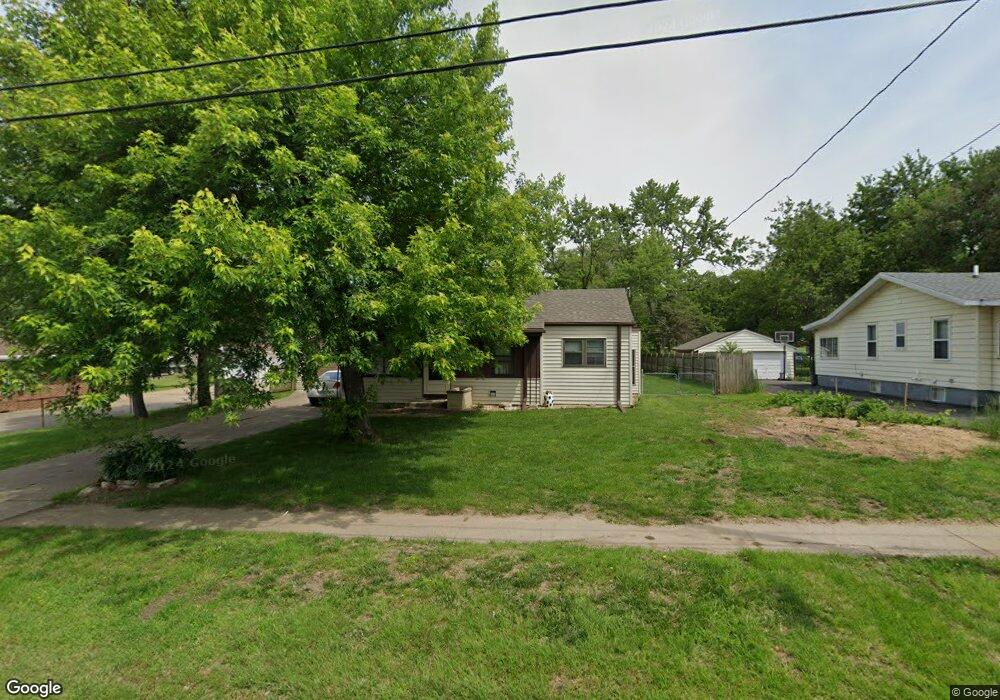
2422 E Sheridan Ave Des Moines, IA 50317
Fairmont Park NeighborhoodEstimated Value: $173,000 - $194,359
2
Beds
1
Bath
884
Sq Ft
$203/Sq Ft
Est. Value
About This Home
This home is located at 2422 E Sheridan Ave, Des Moines, IA 50317 and is currently estimated at $179,590, approximately $203 per square foot. 2422 E Sheridan Ave is a home located in Polk County with nearby schools including Garton Elementary School, Goodrell Middle School, and North High School.
Ownership History
Date
Name
Owned For
Owner Type
Purchase Details
Closed on
Mar 24, 2015
Sold by
Hall Jason Eugene
Bought by
Parker Craig S
Current Estimated Value
Home Financials for this Owner
Home Financials are based on the most recent Mortgage that was taken out on this home.
Original Mortgage
$86,406
Outstanding Balance
$66,349
Interest Rate
3.75%
Mortgage Type
FHA
Estimated Equity
$113,241
Purchase Details
Closed on
Aug 25, 2011
Sold by
Hall Mandi Dawn
Bought by
Hall Jason Eugene
Purchase Details
Closed on
May 22, 2000
Sold by
Ehlers Joseph J
Bought by
Hall Jason and Hall Mandi
Home Financials for this Owner
Home Financials are based on the most recent Mortgage that was taken out on this home.
Original Mortgage
$68,200
Interest Rate
8.14%
Mortgage Type
VA
Purchase Details
Closed on
May 5, 1997
Sold by
Ehlers Herman J
Bought by
Ehlers Herman J and Ehlers Joseph J
Create a Home Valuation Report for This Property
The Home Valuation Report is an in-depth analysis detailing your home's value as well as a comparison with similar homes in the area
Home Values in the Area
Average Home Value in this Area
Purchase History
| Date | Buyer | Sale Price | Title Company |
|---|---|---|---|
| Parker Craig S | $88,000 | None Available | |
| Hall Jason Eugene | -- | None Available | |
| Hall Jason | $66,500 | -- | |
| Ehlers Herman J | -- | -- |
Source: Public Records
Mortgage History
| Date | Status | Borrower | Loan Amount |
|---|---|---|---|
| Open | Parker Craig S | $86,406 | |
| Previous Owner | Hall Jason | $68,200 |
Source: Public Records
Tax History Compared to Growth
Tax History
| Year | Tax Paid | Tax Assessment Tax Assessment Total Assessment is a certain percentage of the fair market value that is determined by local assessors to be the total taxable value of land and additions on the property. | Land | Improvement |
|---|---|---|---|---|
| 2025 | $2,980 | $171,400 | $35,800 | $135,600 |
| 2024 | $2,980 | $151,500 | $31,200 | $120,300 |
| 2023 | $2,944 | $151,500 | $31,200 | $120,300 |
| 2022 | $2,922 | $124,900 | $26,900 | $98,000 |
| 2021 | $2,794 | $124,900 | $26,900 | $98,000 |
| 2020 | $2,904 | $112,000 | $24,100 | $87,900 |
| 2019 | $2,606 | $112,000 | $24,100 | $87,900 |
| 2018 | $2,580 | $97,000 | $20,400 | $76,600 |
| 2017 | $2,426 | $97,000 | $20,400 | $76,600 |
| 2016 | $2,364 | $89,700 | $18,600 | $71,100 |
| 2015 | $2,364 | $89,700 | $18,600 | $71,100 |
| 2014 | $1,968 | $82,800 | $18,000 | $64,800 |
Source: Public Records
Map
Nearby Homes
- 2809 E 24th St
- 2503 E 24th St
- 2323 E 23rd St
- 2324 E 23rd St
- 2322 Guthrie Ave
- 2216 Lay St
- 2633 Grandview Ave
- 2407 E Tiffin Ave
- 2124 E 23rd St
- 2645 Wisconsin Ave
- 2112 E 23rd St
- 2511 E Ovid Ave
- 2021 E 25th St
- 2718 Richmond Ave
- 3218 E 26th St
- 2719 E Tiffin Ave
- 2100 Searle St
- 2208 Tichenor St
- 2680 Hull Ave
- 2722 E Tiffin Ave
- 2428 E Sheridan Ave
- 2432 E Sheridan Ave
- 2619 E 24th St
- 2421 E Sheridan Ave
- 2601 E 24th St
- 2438 E Sheridan Ave
- 2431 E Sheridan Ave
- 2405 E Sheridan Ave
- 2625 E 24th St
- 2441 E Sheridan Ave
- 2701 E 24th St
- 2610 E 25th St
- 2545 E 24th St
- 2608 E 25th St
- 2612 E 25th St
- 2704 E 25th St
- 2530 Lay St
- 2533 Lay St
- 2546 E 25th St
- 2705 E 24th St